Taxonomic Domains Decoded: A Multidimensional Guide for Biomedical Research and Drug Discovery
This guide provides a comprehensive framework for understanding 'domains' across biological, clinical, and structural contexts, tailored for biomedical researchers and drug development professionals.
Taxonomic Domains Decoded: A Multidimensional Guide for Biomedical Research and Drug Discovery
Abstract
This guide provides a comprehensive framework for understanding 'domains' across biological, clinical, and structural contexts, tailored for biomedical researchers and drug development professionals. It bridges foundational biological taxonomy with its modern applications, exploring the classification of life into Archaea, Bacteria, and Eukarya [citation:1][citation:3][citation:8], and extends this logic to frameworks like the Research Domain Criteria (RDoC) for neuropsychiatry [citation:2] and structural protein domains for drug-target analysis [citation:7]. The content systematically addresses exploratory concepts, methodological applications, common analytical challenges, and validation strategies, offering a holistic resource for improving the precision and translatability of biomedical research.
From Phylogeny to Clinical Phenotypes: Defining Domains Across Biological Scales
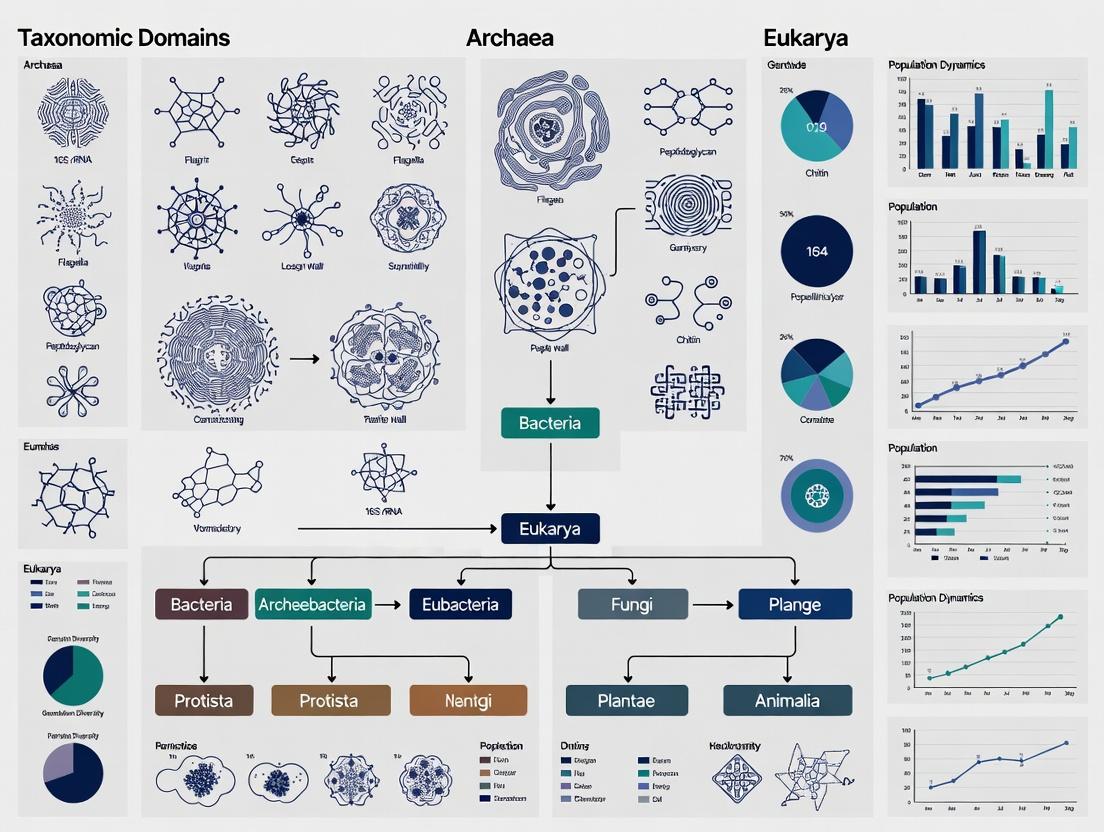
The three-domain system of biological classification, proposed by Carl Woese, Otto Kandler, and Mark Wheelis in 1990, represents a fundamental phylogenetic framework that categorizes all cellular life into the domains Archaea, Bacteria, and Eukarya [1]. This system was established primarily through comparative analysis of the 16S ribosomal RNA (rRNA) gene, which revealed that Archaea constitute a lineage distinct from both Bacteria and Eukaryotes [1] [2].
For three decades, this model has served as a central paradigm in biology, fundamentally altering our understanding of life's diversity by recognizing the profound molecular and biochemical differences between the two prokaryotic groups [3] [4]. However, recent advances in phylogenomics and the discovery of Asgardarchaeota—archaeal lineages possessing an unprecedented number of eukaryotic signature proteins—have challenged this view [5]. A growing body of evidence now suggests that eukaryotes likely originated from within the Archaea, specifically as a sister clade to the Heimdallarchaeia within the Asgardarchaeota [6] [5]. This has sparked a vigorous scientific debate between proponents of the classic three-domain model and those advocating for a two-domain system (Archaea and Bacteria) where Eukarya is a specialized branch of Archaea [1] [4].
This whitepaper synthesizes current research to provide an in-depth technical guide to the three domains. Framed within the context of Adverse Outcome Pathway (AOP) wiki-guided taxonomic research, we examine the defining molecular and physiological characteristics of each domain, detail cutting-edge experimental methodologies for their comparative study, and explore the critical implications of this taxonomic framework for modern drug discovery and development.
Current Phylogenetic Debates: Two Domains vs. Three Domains
The central debate in modern taxonomy revolves around the precise origin of eukaryotes. The classical three-domain tree posits that Archaea and Eukarya are sister clades that diverged from a common ancestor after its separation from the bacterial lineage [1]. In contrast, the emerging two-domain hypothesis, supported by increasingly robust phylogenomic datasets, places eukaryotes as a branch nested within the Archaea [6] [5].
Table 1: Key Evidence in the Two-Domain vs. Three-Domain Debate
| Supporting Evidence for Two-Domain System | Supporting Evidence for Three-Domain System |
|---|---|
| Phylogenomic analyses place eukaryotes within Asgardarchaeota, often as a sister to Heimdallarchaeia [5]. | The eukaryotic cell represents a unique, complex chimeric system distinct from prokaryotic archaeal ancestors [4]. |
| Discovery of eukaryotic signature proteins (ESPs) in Asgard archaeal genomes, suggesting a shared genetic toolkit [5]. | Eukaryotes possess a massive number of genes of bacterial origin (approximately three times more than archaeal genes) [4]. |
| Cultivation of Asgard archaea (e.g., Candidatus Prometheoarchaeum syntrophicum) reveals cellular features (e.g., actin-based cytoskeleton) once considered exclusive to eukaryotes [5]. | Fundamental cellular systems, like the cytosolic ribosome, are uniquely eukaryotic innovations, not merely modified archaeal systems [4]. |
| Models like the hydrogen hypothesis propose eukaryogenesis via symbiosis between an H2-dependent archaeal host and an alpha-proteobacterium [5]. | The process of symbiogenesis created a genuinely new cell type that transcends its archaeal and bacterial parts [4]. |
A pivotal 2025 study analyzing 223 new Asgard archaeal genomes used sophisticated phylogenomic approaches (including site-heterogeneous evolutionary models) to conclude that eukaryotes form a sister clade to all Heimdallarchaeia, not a branch within it [5]. This finding supports a two-domain topology. Defenders of the three-domain model argue that while eukaryotes have an archaeal ancestor, the endosymbiotic merger with a bacterium and subsequent massive genomic innovation created a cell type so fundamentally different that it merits domain-level distinction [4]. They contend that taxonomy should reflect this fundamental disparity in cellular organization, not just nested phylogenetic ancestry.
Core Taxonomic Comparison of the Three Domains
Despite the phylogenetic debate, the operational classification of life into three domains remains useful for comparing their core molecular and cellular biology. The distinctions are foundational for interpreting experiments and understanding biological function across the tree of life.
Table 2: Defining Molecular and Cellular Characteristics of the Three Domains
| Characteristic | Archaea | Bacteria | Eukarya |
|---|---|---|---|
| Nuclear Membrane | Absent (Prokaryotic) | Absent (Prokaryotic) | Present [1] [2] |
| Cell Wall Composition | Variable; no peptidoglycan. May contain pseudomurein or other polysaccharides [2]. | Contains peptidoglycan (murein) [2]. | If present, composed of cellulose (plants), chitin (fungi), or none (animals). |
| Membrane Lipids | Ether-linked branched hydrocarbon chains (isoprenoids) [2]. | Ester-linked straight fatty acid chains (diacyl glycerol diesters) [1] [2]. | Ester-linked straight fatty acid chains [2]. |
| Ribosome Structure | 70S (shared with Bacteria) but rRNA sequence is unique and distinct [2]. | 70S [2]. | 80S (cytosolic); 70S (mitochondrial/chloroplast). |
| Initiator tRNA | Methionine (as in Eukarya) [2]. | Formyl-methionine [2]. | Methionine [2]. |
| Antibiotic Sensitivity | Not sensitive to typical antibacterial antibiotics (e.g., streptomycin, chloramphenicol) [2]. | Sensitive to antibacterial antibiotics [2]. | Sensitive to antibiotics targeting eukaryotic-specific processes (e.g., anisomycin, cycloheximide) [2]. |
| RNA Polymerase | Single, complex enzyme (multiple subunits), similar to eukaryotic RNA Polymerase II [2]. | Single, simpler enzyme (fewer subunits) [2]. | Three distinct, complex enzymes (RNA Pol I, II, III). |
| Gene Structure | Genes often organized in operons, no introns in most genes [2]. | Genes often organized in operons, no introns [2]. | Genes not typically in operons, many contain introns. |
A critical ecological comparison is provided by the Global rRNA Universal Metabarcoding Plankton (GRUMP) database (2025), which quantified domain-level abundance across the global ocean using universal primers [7]. This study provides a rare, directly comparable quantitative snapshot:
- Bacteria dominated rRNA gene abundance, contributing an average of 71%.
- Eukarya contributed 19% on average, but their contribution increased to 32% at latitudes above 40°.
- Archaea contributed 8% on average [7].
Methodologies for Cross-Domain Analysis and the GRUMP Protocol
Modern research into the domains of life relies on advanced molecular techniques that allow for direct, quantitative comparison. The GRUMP study exemplifies a state-of-the-art, holistic approach [7].
The GRUMP Experimental Workflow
The GRUMP protocol enables the simultaneous quantification of organisms from all three domains from a single environmental sample, overcoming historical limitations of separate analyses.
Detailed Methodology
- Sample Collection & Preservation: Large volumes (0.7–10 L) of whole, unfractionated seawater are collected via Niskin bottles or ship intake systems from surface to deep depths (>6000 m). Samples are immediately filtered onto 0.22 µm polyethersulfone (Supor) or PVDF (Sterivex) filters to capture all cellular life. Filters are preserved with RNAlater or similar buffer and stored at -80°C [7].
- DNA Extraction & Universal PCR: Community DNA is extracted directly from filters. The key step is amplification using the universal primer pair 515Y/926R, which binds to conserved regions and simultaneously amplifies the 16S rRNA gene from Bacteria and Archaea and the 18S rRNA gene from Eukarya in a single reaction. This eliminates primer bias and allows for direct cross-domain quantification [7].
- Sequencing & Bioinformatics: Amplicons are sequenced on Illumina platforms. Sequences are processed through pipelines like QIIME2 and denoised using DADA2 to generate high-resolution Amplicon Sequence Variants (ASVs). Taxonomy is assigned using reference databases (e.g., SILVA, GTDB). The direct output is a single table containing the relative abundance of ASVs from all three domains [7].
The Scientist's Toolkit: Key Reagents & Materials
Table 3: Essential Research Reagents and Materials for Cross-Domain Metabarcoding (Based on GRUMP Protocol) [7]
| Item | Function/Description | Key Characteristic |
|---|---|---|
| 515Y/926R Universal Primers | Amplify 16S (Bacteria/Archaea) and 18S (Eukarya) rRNA genes simultaneously. | Enables direct, quantitative comparison across all three domains from one PCR reaction [7]. |
| 0.22 µm Sterivex or Supor Filters | Capture all cellular biomass from unfractionated water samples. | Polyethersulfone (PES) or PVDF membrane; compatible with direct in-filter lysis and DNA extraction [7]. |
| RNAlater or Similar Preservation Buffer | Stabilizes RNA and DNA immediately upon filtration, inhibiting degradation. | Critical for preserving an accurate snapshot of the active microbial community [7]. |
| DADA2 Algorithm (in QIIME2/R) | Models and corrects Illumina sequencing errors to infer exact biological sequences (ASVs). | Provides single-nucleotide resolution, superior to traditional OTU clustering methods [7]. |
| Genome Taxonomy Database (GTDB) | Provides a standardized bacterial and archaeal taxonomy based on genome phylogeny. | Used for consistent and phylogenetically robust taxonomic assignment of prokaryotic ASVs [5]. |
Implications for Drug Discovery and Biomedical Research
The distinctions between the three domains have profound practical implications for human health and therapeutic development.
- Antibiotic Specificity: The fundamental differences in cell wall composition (peptidoglycan in Bacteria), ribosome structure, and enzyme function between Bacteria and Archaea/Eukarya are the foundation of antibiotic therapy. Most antibiotics target uniquely bacterial pathways, exploiting domain-specific biology to achieve selective toxicity [2]. The resistance of Archaea to common antibacterial drugs underscores the depth of this divergence [2].
- Eukaryotic Cell Culture & Disease Modeling: Drug screening has historically relied on 2D monolayer cultures of eukaryotic (often human) cells. However, these models fail to recapitulate the three-dimensional tissue microenvironment, including extracellular matrix (ECM) interactions, stiffness, and nutrient gradients, leading to high failure rates in clinical trials [8]. Advanced 3D cell culture models (spheroids, organoids, hydrogel-based systems) that better mimic in vivo eukaryotic tissue architecture are now recognized as crucial for improving the predictive power of preclinical drug testing [8].
- Multi-Domain Endpoints in Rare Disease Trials: For complex, multi-system diseases like AL amyloidosis, where pathology affects multiple organ systems (a "multi-domain" impact), defining clinical trial endpoints is challenging. Regulatory science is advancing frameworks for Multi-Domain Endpoints (MDEs), such as composite responder indices or time-to-progression endpoints, that holistically capture patient benefit across different affected domains (e.g., cardiac, renal, neurological) [9]. This approach acknowledges that a therapy's efficacy may need to be assessed across a spectrum of eukaryotic tissue and organ systems simultaneously.
In conclusion, the three-domain system provides an essential, if evolving, framework for understanding the fundamental divisions of life. While phylogenomic data may redraw the branches of the tree of life, the operational and biochemical distinctions between Archaea, Bacteria, and the complex eukaryotic cell remain critically relevant. From guiding the interpretation of global ecosystem surveys like GRUMP to informing the development of next-generation therapeutics and clinical trial designs, this taxonomic perspective continues to shape research across the biological sciences.
Core Characteristics and Evolutionary Significance of Each Biological Domain
The classification of cellular life into three domains—Archaea, Bacteria, and Eukarya—represents a fundamental phylogenetic framework established on differences in ribosomal RNA sequences, membrane lipid structure, and sensitivity to antibiotics [2]. This taxonomic system provides the essential scaffolding for biological research, including the organization of knowledge within the Adverse Outcome Pathway (AOP) Wiki. Within the AOP context, understanding the unique molecular and physiological machinery of each domain is critical for identifying Domain-Specific Molecular Initiating Events (MIEs). For instance, a bacterial endotoxin (common in Bacteria) and a disruption of histone deacetylase (exclusive to Eukarya) represent distinct MIEs requiring domain-aware research tools and models. This whitepaper details the core characteristics and evolutionary significance of each domain, providing researchers and drug development professionals with a structured, technical guide to inform target identification, model selection, and hazard assessment within a modern phylogenetic context.
Core Characteristics of the Three Domains
The defining characteristics of each domain stem from profound differences in cellular architecture, genetic machinery, and biochemistry. The following table provides a comparative summary of these core features.
Table 1: Comparative Core Characteristics of the Three Biological Domains
| Characteristic | Domain Bacteria | Domain Archaea | Domain Eukarya |
|---|---|---|---|
| Cell Type | Prokaryotic | Prokaryotic | Eukaryotic |
| Nuclear Membrane | Absent | Absent | Present |
| Membrane Lipid Structure | Ester-linked fatty acids to glycerol (Diacyl glycerol diester lipids) [1]. | Ether-linked branched hydrocarbon chains (often with rings) to glycerol [2]. | Ester-linked fatty acids to glycerol. |
| Cell Wall Composition | Contains peptidoglycan (muramic acid). | No peptidoglycan; variety of other polysaccharides and proteins [2]. | If present, composed of cellulose, chitin, or other polysaccharides (no peptidoglycan). |
| Ribosomal RNA | Distinct 16S rRNA sequence. | Distinct 16S rRNA sequence; shares some features with eukaryotes [2]. | Distinct 18S rRNA sequence. |
| Initiator tRNA | Formylmethionine | Methionine | Methionine |
| Antibiotic Sensitivity | Sensitive to classic antibiotics (e.g., chloramphenicol, streptomycin) that do not affect Archaea [2]. | Not sensitive to classic bacterial antibiotics; sensitive to some eukaryotic inhibitors [2]. | Sensitive to different inhibitors. |
| Typical Ecological Niches | Ubiquitous; soil, water, hosts, extreme environments. | Often extremophiles (thermophiles, halophiles, acidophiles, methanogens) [2] [1]. | Ubiquitous; wide range of multicellular and unicellular forms. |
Evolutionary Significance and the Ongoing Debate
The evolutionary relationships between the three domains are a subject of active research and debate, with significant implications for understanding the origin of complex life.
The Three-Domain System: Proposed by Carl Woese, this model posits that Archaea and Eukarya are sister groups that share a more recent common ancestor with each other than either does with Bacteria [1]. This was primarily based on comparative analysis of 16S and 18S ribosomal RNA gene sequences.
The Two-Domain System: Emerging from the eocyte hypothesis, this revised model is supported by increasingly robust phylogenomic analyses. It proposes that Eukarya emerged from within the Archaea, specifically from a proposed archaeal lineage known as the Asgard archaea (e.g., Lokiarchaeota, Heimdallarchaeota) [10] [6]. Critical evidence includes the discovery of "eukaryotic signature proteins" (ESCRT, actin, tubulin, ubiquitin homologs) within Asgard archaeal genomes, suggesting the archaeal ancestor of eukaryotes possessed a primitive cytoskeleton and membrane-remodeling capabilities essential for phagocytosis [10].
This evolutionary synthesis suggests a two-stage process for the origin of eukaryotes: first, the emergence of a complex archaeal host from within the Asgard lineage, followed by an endosymbiotic event with an alphaproteobacterium that became the mitochondrion.
Experimental Methodologies for Domain Research
Protocol: 1D Bidomain Cable Modeling for Eukaryotic Cellular Electrophysiology
This protocol, adapted from photoreceptor research [11], details the creation of a biophysically detailed model to relate subcellular ion currents to organ-level physiological signals, a technique applicable to eukaryotic cells with elongated morphology (e.g., neurons, muscle cells).
1. Single-Cell Model Specification:
- Base Model Selection: Adopt a validated, species-relevant ion current model. For mammalian cells where specific models are lacking, a modified model from a related vertebrate (e.g., the Kamiyama model for salamander photoreceptors) can serve as a foundation [11].
- Current Kinetics Refinement: Replace specific current kinetics to match target species data. For example, to model mouse photoreceptors, substitute the photocurrent (Iphoto) model with a mouse-specific cyclic nucleotide-gated (CNG) channel model to achieve accurate response time courses [11].
- Calcium Dynamics Implementation: Incorporate a minimal, functional intracellular calcium system with submembrane and central compartments to regulate calcium-dependent currents (e.g., ICl(Ca), IK(Ca)) [11].
2. 1D Cable Geometry Construction:
- Compartmentalization: Divide the cell's geometry into discrete cylindrical compartments representing key structural domains (e.g., Outer Segment, Inner Segment, Cell Body, Synaptic Terminal for a neuron) [11].
- Parameter Assignment: Assign each compartment its specific diameter, length, and intracellular resistivity based on morphological literature for the target cell type.
3. Ion Current Distribution Mapping:
- Localization: Define the specific density or maximum conductance of each ion channel type (e.g., Ih, IKv, ICa) within each cellular compartment based on immunohistochemical and electrophysiological literature [11].
- Integration: Incorporate the distributed currents into the cable equation framework, linking the transmembrane potential along the cell's length.
4. Forward Simulation and Validation:
- Stimulus Application: Apply a physiological stimulus (e.g., light pulse, synaptic current injection).
- Output Calculation: Simulate to calculate both the intracellular voltage spread and the extracellular field potential generated by the net transmembrane current loops.
- Validation: Compare the simulated extracellular field potential (e.g., the electroretinogram a-wave) directly against empirical recordings to validate the model [11].
Protocol: 3D Bidomain Modeling & Deep Learning for Tissue Electrophysiology
This protocol outlines a hybrid simulation-AI approach for non-invasive electrophysiological imaging, applicable to studying cardiac or neural tissue in all domains, particularly complex eukaryotic systems [12].
1. Anatomically Simplified 3D Bidomain Model Construction:
- Geometry Creation: Build a simplified 3D mesh incorporating core anatomical structures (e.g., torso, lungs, heart with chambers and conduction system) [12].
- Tissue Property Assignment: Assign conductivity and permittivity values to each anatomical subdomain (e.g., heart muscle, blood, lungs, torso) based on published biological measurements [12].
- Electrophysiology Modeling: Implement a spatio-temporal cardiac action potential model (e.g., a modified FitzHugh-Nagumo model) within the heart tissue to simulate propagating electrical waves [12].
2. Forward Problem Simulation & Dataset Generation:
- Electrode Placement: Define virtual electrode locations on the model's surface corresponding to standard recording setups (e.g., 64-lead body surface mapping) [12].
- Simulation Run: Solve the bidomain equations to compute the cardiac transmembrane potentials and the resulting body surface potentials over time.
- Dataset Curation: Generate a large-scale dataset pairing simulated cardiac surface potential maps (the "source") with body surface potential maps (the "measured signal") [12].
3. Deep Learning Model Training for the Inverse Problem:
- Algorithm Selection: Train and compare different neural network architectures to solve the inverse problem of reconstructing cardiac potentials from surface signals.
- PSO-BP Network: A traditional back-propagation network optimized with a Particle Swarm Optimizer [12].
- Convolutional Neural Network (CNN): To capture spatial relationships in the potential maps [12].
- Long Short-Term Memory Network (LSTM): To capture the temporal dynamics of the propagating signals [12].
- Training: Use the simulated dataset to train the networks, treating body surface maps as input and cardiac surface maps as the target output.
- Validation: Assess reconstruction accuracy against held-out simulated data and, where possible, limited clinical data [12].
Visualizations of Evolutionary Relationships and Experimental Workflows
Diagram 1: Evolutionary relationships showing the three-domain and two-domain systems.
Diagram 2: Workflow for constructing and using a 1D bidomain cable model.
The Scientist's Toolkit: Key Research Reagent Solutions
Table 2: Key Research Reagents and Models for Domain-Specific Investigations
| Reagent/Model | Domain of Application | Core Function |
|---|---|---|
| Modified Kamiyama Photoreceptor Model [11] | Eukarya | Provides a foundational single-cell electrophysiological model with detailed ion current dynamics, adaptable for studying sensory neurons or other excitable eukaryotic cells. |
| FitzHugh-Nagumo-type Bidomain Models [12] | Primarily Eukarya (Cardiac/Muscle) | Enables simulation of action potential propagation across 2D or 3D tissues, crucial for studying cardiac arrhythmias or neural network activity. |
| COMSOL Multiphysics with Bioelectrical Modules | All Domains | Finite element analysis software for solving complex bidomain or volume conductor problems in custom 3D geometries (e.g., whole heart-torso models) [12]. |
| LSTM/CNN Neural Network Frameworks [12] | All Domains | Deep learning architectures for solving inverse problems in electrophysiological imaging (e.g., reconstructing cardiac potentials from body surface maps) or analyzing complex phylogenetic datasets. |
| 16S/18S rRNA Universal Primers | Bacteria & Archaea / Eukarya | For PCR amplification and sequencing of the standard phylogenetic marker genes, enabling identification and evolutionary placement of organisms within their domains. |
| Archaeal Ether Lipid Analogs | Archaea | Chemical probes used to study the unique membrane biophysics of Archaea, their stability under extreme conditions, and their role in hypothesized eukaryotic origin events. |
| Eukaryotic Signature Protein (ESP) Antibodies | Eukarya & Asgard Archaea | Immunological tools to detect homologs of eukaryotic cytoskeletal (e.g., actin) and membrane-trafficking proteins in Asgard archaeal samples, testing hypotheses of eukaryotic origins [10]. |
The classical biological taxonomy of Archaea, Bacteria, and Eukarya represents a foundational framework for classifying life based on genetic and cellular divergence [13]. However, contemporary research, particularly within fields like the Adverse Outcome Pathway (AOP) wiki framework, necessitates a broader conceptualization. This guide proposes an extension of the "domain" concept beyond phylogenetic classification to encompass functional research domains and pathological disease domains. This tripartite model—taxonomic, research, and disease—facilitates a more integrated systems-biology approach, crucial for understanding complex biological interactions and translating basic research into therapeutic strategies.
The core thesis is that the principles defining a biological domain—shared fundamental characteristics, common evolutionary constraints, and distinct functional boundaries—can be abstracted and applied to other strata of biological organization. A research domain is defined by a cohesive set of methodologies, model systems, and scientific questions (e.g., metagenomics, extremophile biology). A disease domain is defined by shared pathophysiological mechanisms and molecular pathways that cross traditional organismal boundaries (e.g., protein misfolding disorders, dysbiosis-related diseases). This conceptual extension enables researchers to draw more powerful parallels, identify conserved mechanisms, and develop cross-cutting methodologies.
Table 1: Comparative Framework for Traditional and Extended Domain Concepts
| Domain Type | Defining Principle | Key Characteristics | Primary Unit of Analysis |
|---|---|---|---|
| Taxonomic (Classical) | Evolutionary lineage & genetic divergence [13] | Cellular organization, ribosomal RNA, membrane lipids | Species, Phylum, Kingdom |
| Research (Methodological) | Shared tools, models, & core questions | Standardized protocols, defined model systems, analytical pipelines | Experimental paradigm, technological platform |
| Disease (Pathological) | Shared etiological mechanisms & pathway dysregulation | Common molecular initiators, key events, adverse outcomes | Pathway, network, mechanistic cluster |
Extending Domains into Research Methodologies
The Research Domain of Metagenomics and Uncultivated Taxa
Research domains are characterized by their distinctive toolkits and epistemic goals. The domain of metagenomics and uncultivated microbial research exemplifies this. It focuses on organisms resistant to standard laboratory cultivation, requiring a complete methodological shift from isolation-based microbiology to sequence-based environmental sampling [14].
Core Experimental Protocol: Genome-Resolved Metagenomics for Archaeal Expansion This protocol, derived from studies that defined new archaeal phyla, details the process for reconstructing genomes from complex environmental consortia [14].
- Sample Collection & DNA Extraction: Collect biomass from target environment (e.g., aquifer sediment). Use harsh lysis methods (e.g., bead-beating) to access DNA from robust archaeal cells. Quantity and quality are assessed via fluorometry and gel electrophoresis.
- Shotgun Sequencing Library Preparation: Fragment purified DNA, size-select fragments (typically 300-800 bp), and attach platform-specific adapters. Use minimal amplification cycles to reduce bias.
- High-Throughput Sequencing: Perform paired-end sequencing on an Illumina NovaSeq or PacBio HiFi platform to generate both high-coverage and long-read data for accurate assembly.
- Metagenomic Assembly & Binning: Assemble short reads into contiguous sequences (contigs) using assemblers like MEGAHIT or metaSPAdes. Bin contigs into putative genomes based on sequence composition (k-mer frequency) and abundance profiles across samples using tools like MaxBin or MetaBAT2.
- Genome Refinement & Quality Assessment: Use long reads to scaffold and close genomes. Check for contamination using CheckM. Assign taxonomy based on a set of conserved marker genes. Only "high-quality" draft or complete genomes (e.g., >90% complete, <5% contamination) are used for downstream analysis [14].
- Metabolic Reconstruction & Phylogenomics: Annotate genomes via PROKKA or RAST. Predict metabolic pathways from annotated genes using KEGG or MetaCyc. Perform phylogenomic analysis by concatenating ribosomal protein sequences to place novel genomes within the archaeal tree.
Table 2: Key Methodological Approaches in Extended Research Domains
| Research Domain | Exemplar Methodology | Target System | Key Outcome |
|---|---|---|---|
| Metagenomics | Genome-resolved assembly from environmental DNA [14] | Uncultivated microbial consortia | Reconstruction of genomes, discovery of new phyla |
| Extremophile Biology | Functional characterization of extremozymes [15] | Proteins from thermo-, halo-, psychrophiles | Enzymes stable under industrial process conditions |
| Single-Cell 'Omics | Single-cell genome/transcriptome sequencing | Rare cell types, complex tissues | High-resolution view of cellular heterogeneity |
The Research Domain of Extremophile Biology
Extremophile research constitutes another distinct domain, unified by the study of life under physical and chemical extremes (e.g., temperature, pH, salinity) [15]. The core objective is to understand adaptive mechanisms and harness them biotechnologically.
Core Experimental Protocol: Characterization of an Extremozyme This protocol outlines the steps for isolating and characterizing a stable enzyme from an extremophile [15].
- Strain Cultivation & Cell Lysis: Grow the extremophile (e.g., thermophilic archaeon Pyrococcus furiosus) under its optimal extreme conditions. Harvest cells by centrifugation. Lyse cells using sonication or French press in an appropriate buffer, maintaining conditions that preserve native protein structure.
- Protein Purification: Clarify lysate by ultracentrifugation. Employ a purification series: ammonium sulfate precipitation, followed by column chromatography (e.g., ion-exchange, hydrophobic interaction, and size-exclusion chromatography). Monitor purity via SDS-PAGE.
- Activity Assay Under Extreme Conditions: Design an assay for the enzyme's specific activity (e.g., protease, polymerase). Measure activity across a gradient of the extreme parameter (e.g., temperature from 20°C to 120°C, or pH 2-11). Compare to a mesophilic homolog. Use spectrophotometry or fluorometry to quantify substrate conversion.
- Biophysical Characterization: Determine thermostability by measuring residual activity after incubation at high temperatures over time. Use differential scanning calorimetry (DSC) to measure melting temperature (Tm). Analyze structure via X-ray crystallography or cryo-electron microscopy if possible.
- Application Testing: Test the extremozyme's performance in an industrial or molecular biology application (e.g., a thermostable polymerase in PCR, a halophilic protease in detergent formulations).
Diagram 1: Framework for extending biological domain concepts.
Extending Domains into Disease Mechanisms
The Disease Domain of Conserved Stress Responses
Pathological processes can be clustered into disease domains based on shared initiating events and dysregulated core pathways, irrespective of the host organism. This is a cornerstone principle in AOP development. A prime example is the domain of proteotoxic stress and aggregation diseases, which includes Alzheimer's disease in humans, certain prion-like phenomena in fungi, and even inclusion body formation in recombinant bacterial protein production [15]. The shared molecular initiating event is protein misfolding, leading to a common key event of toxic oligomer or amyloid formation.
The Disease Domain of Host-Associated Microbiome Dysbiosis
Another critical disease domain is dysbiosis-associated pathophysiology. Here, the initiating event is a shift in the taxonomic domain composition (the microbiome) that disrupts the functional equilibrium of the host superorganism [13]. This dysbiosis can trigger conserved host response pathways—such as inflammasome activation or barrier dysfunction—leading to diverse adverse outcomes like inflammatory bowel disease, metabolic syndrome, or even neurological disorders. This domain explicitly links taxonomic diversity (microbial community) to host disease pathology.
Diagram 2: Cross-species disease domains mapped to AOP-like pathways.
The Scientist's Toolkit: Essential Research Reagent Solutions
Table 3: Key Research Reagent Solutions for Cross-Domain Research
| Reagent/Material | Function | Exemplar Use-Case |
|---|---|---|
| Magnetic Bead-based DNA/RNA Shield Kits | Stabilizes nucleic acids in field-collected samples from extreme environments. Prevents degradation prior to metagenomic sequencing. | Preserving microbial community DNA from hydrothermal vent fluid or acidic soil [14] [15]. |
| Phusion or Q5 High-Fidelity DNA Polymerase | Engineered, thermostable enzymes for accurate PCR amplification. Derived from thermophilic bacteria, exemplifying extremophile application. | Amplifying target genes from low-biomass metagenomic samples or constructing sequencing libraries [15]. |
| Anaerobic Chamber & Reducing Media | Creates oxygen-free atmosphere and culture conditions for growing obligate anaerobic Archaea and Bacteria. | Cultivating novel archaeal species from subsurface sediments for physiological study [14]. |
| Specialized Extremophile Culture Media | Media formulated with specific salts, pH buffers, and carbon sources to mimic extreme natural habitats (e.g., high salinity, high temperature). | Isolating and maintaining pure cultures of halophiles or thermophiles for extremozyme production [15]. |
| Recombinant Protein Purification Kits (His-tag) | Streamlined columns for purifying recombinant extremozymes expressed in model systems like E. coli. | Rapid purification of a thermostable archaeal polymerase for functional characterization [15]. |
| Cellular Stress Assay Kits (e.g., ER Stress, Oxidative Stress) | Fluorogenic or colorimetric assays to measure conserved stress pathway activation in model cells. | Quantifying proteotoxic stress response in yeast models of neurodegenerative disease, linking to extremophile protein stability studies. |
Synthesis and Integration for the AOP Wiki Framework
The integration of these extended domain concepts directly enriches the AOP wiki paradigm. An AOP is inherently mechanism-based, not taxon-specific. By formally defining disease domains, researchers can more efficiently populate the AOP wiki with modular key events that are relevant across multiple taxonomic contexts. For instance, the key event "Mitochondrial Dysfunction" could be linked to AOPs in the disease domains of neurodegeneration, sepsis, and chemical toxicology.
Furthermore, methodological advances from research domains like metagenomics provide the tools to discover novel taxonomic players (e.g., archaeal phyla) that may act as modifiers or initiators within established AOPs, particularly those related to systemic metabolic or immune outcomes [14]. This creates a dynamic, interconnected knowledge structure where taxonomic discovery, methodological innovation, and mechanistic disease modeling continuously inform one another. This tri-domain perspective fosters the interdisciplinary collaboration essential for solving complex problems in biomedicine and environmental health.
The Research Domain Criteria (RDoC) is a research framework initiated by the U.S. National Institute of Mental Health (NIMH) to address significant limitations in traditional, symptom-based psychiatric classification systems like the Diagnostic and Statistical Manual of Mental Disorders (DSM) [16] [17]. Launched in 2009, RDoC was conceived as a strategic response to the growing awareness that diagnostic categories, while reliable, lack validity as they are not grounded in objective neurobiological measures [16] [18]. The initiative emerged from the recognition that mental disorders are biological disorders involving brain circuits, which implicate specific, measurable domains of cognition, emotion, and behavior [16].
RDoC proposes a paradigm shift in psychopathology research. Instead of starting with heterogeneous clinical syndromes, it begins with an understanding of fundamental neurobehavioral systems derived from basic translational science [19] [17]. The framework is built on several core principles, often termed the "seven pillars of RDoC," which include [19]:
- A translational perspective starting with normative neurobehavioral processes.
- The assumption of a dimensional approach to functioning, spanning from normal to abnormal.
- The integration of multiple levels or units of analysis (from genes to self-reports) to comprehensively understand constructs.
- A focus on research that elucidates mechanisms, with the goal of informing future classification and treatment.
RDoC is explicitly not a clinical diagnostic system; it is a framework to guide research with the ultimate goal of generating data that can lead to better diagnosis, prevention, intervention, and cures [17]. This framework is designed to cut across traditional diagnostic boundaries (transdiagnostic) to address issues of comorbidity and heterogeneity, where individuals with the same diagnosis may share few symptoms or underlying mechanisms [17] [20]. By focusing on dimensional constructs, RDoC aims to elucidate the full range of variation in core psychological and biological systems, thereby identifying mechanisms that can serve as targets for novel therapeutic development and personalized interventions [19] [18].
Core Framework: Domains, Constructs, and the RDoC Matrix
The RDoC framework is operationalized through a heuristic matrix designed to organize research thinking and experimentation [17] [20]. The matrix is structured around two primary axes: Domains/Constructs (rows) and Units of Analysis (columns) [16] [20].
Domains and Constructs: These represent major, evolutionarily conserved areas of human neurobehavioral functioning. The framework identifies six broad domains, each containing more specific constructs and subconstructs [20]. Table 1: RDoC Domains and Example Constructs
| Domain | Primary Function | Example Constructs |
|---|---|---|
| Negative Valence Systems | Response to aversive stimuli | Acute Threat ("Fear"), Potential Threat ("Anxiety"), Sustained Threat, Loss, Frustrative Nonreward [16] |
| Positive Valence Systems | Response to rewarding stimuli | Reward Responsiveness, Reward Learning, Reward Valuation, Habit [16] |
| Cognitive Systems | Cognitive processes | Attention, Perception, Working Memory, Declarative Memory, Cognitive Control [20] |
| Systems for Social Processes | Interpersonal behavior | Affiliation and Attachment, Social Communication, Perception and Understanding of Self/Others [20] |
| Arousal/Regulatory Systems | Arousal and homeostasis | Arousal, Circadian Rhythms, Sleep-Wake Cycle [20] |
| Sensorimotor Systems | Motor behavior and agency | Motor Actions, Agency [20] |
Units of Analysis: This axis represents the different classes of variables or measures that can be used to study a given construct. Researchers are encouraged to collect data from multiple units to obtain an integrative understanding [19] [17]. The eight units are: Genes, Molecules, Cells, Circuits, Physiology, Behavior, Self-Reports, and Paradigms (experimental tasks) [16].
A defining feature of the RDoC approach is its dimensional perspective. Constructs are conceptualized as continuous dimensions that can be measured across a spectrum of functioning, from normal to severely impaired, rather than as present/absent categories [19] [17]. This allows for the study of subclinical symptoms and the investigation of how specific system dysfunctions contribute to various forms of psychopathology, irrespective of diagnostic label [20].
Integration with the Adverse Outcome Pathway (AOP) Framework and Taxonomic Domains
The RDoC framework shares significant conceptual synergy with the Adverse Outcome Pathway (AOP) paradigm used in toxicology and ecotoxicology, particularly in the context of defining Taxonomic Domains of Applicability (tDOA). An AOP is a structured sequence of events linking a Molecular Initiating Event (MIE)—such as a chemical binding to a receptor—through a series of intermediate Key Events (KEs) to an Adverse Outcome (AO) of regulatory relevance [21]. The core challenge in both frameworks is moving from a narrow, model-specific understanding to a generalizable, mechanism-based taxonomy applicable across species or diagnostic categories.
RDoC can be conceptualized as providing the taxonomic domains for neuropsychiatric AOPs. In this analogy:
- RDoC Domains and Constructs (e.g., Positive Valence Systems, Reward Learning) define the functional space of neurobehavioral pathways.
- The Units of Analysis (genes, circuits, behavior) correspond to the levels of biological organization within an AOP (molecular, cellular, organ, organism).
- A neuropsychiatric AOP would describe a causal chain where a perturbation (e.g., a genetic variant, stressor) leads to dysfunction in an RDoC-defined construct, propagating through related constructs and ultimately manifesting as a clinically identifiable syndrome or adverse health outcome [22].
The AOP framework's rigorous approach to defining tDOA—the species or populations for which an AOP is relevant—offers a methodological blueprint for RDoC [23]. Establishing the tDOA for an RDoC-based pathway involves evaluating the conservation of structure and function across human populations or between preclinical models and humans [23]. Tools like the Sequence Alignment to Predict Across Species Susceptibility (SeqAPASS) bioinformatics platform, which assesses the conservation of protein sequences and functional domains, can be adapted to evaluate the conservation of neural circuit components, receptor systems, or genetic pathways central to an RDoC construct [23]. This provides empirical, biologically plausible evidence for the boundaries of a research domain, moving beyond assumptions based solely on diagnostic similarity.
Table 2: Conceptual Alignment Between RDoC and AOP Frameworks
| AOP Framework Component | RDoC Analog | Purpose in Integration |
|---|---|---|
| Molecular Initiating Event (MIE) | Perturbation at a Unit of Analysis (e.g., genetic variant, circuit dysfunction) | Identifies the initial biological point of departure from normal function. |
| Key Event (KE) | Measurable change within or across RDoC Constructs | Defines essential, measurable steps in the pathway from mechanism to manifestation. |
| Key Event Relationship (KER) | Causal linkage between dysfunctions in constructs | Provides the empirical and theoretical basis for the pathway's sequence. |
| Adverse Outcome (AO) | Clinically significant syndrome or functional impairment | Anchors the pathway to a meaningful health outcome. |
| Taxonomic Domain of Applicability (tDOA) | Applicable patient populations or translational models | Defines the boundaries within which the mechanistic pathway is valid. |
The integrative workflow below illustrates how RDoC constructs and AOP principles merge to form a mechanism-based taxonomy for research.
Diagram 1: Integrative RDoC-AOP Framework for Taxonomic Research [21] [17] [23]
Experimental Methodologies and Protocol Design
Implementing the RDoC framework requires research designs that break from traditional case-control studies based on DSM diagnoses. Instead, protocols focus on dimensional measurement of specific constructs across multiple units of analysis in carefully phenotyped samples [19].
Protocol 1: Probing a Transdiagnostic Construct Using Multi-Method Assessment
This protocol outlines a study targeting the Reward Prediction Error (RPE) subconstruct within the Positive Valence Systems domain, a mechanism implicated in depression, schizophrenia, and substance use disorders [19] [22].
Objective: To characterize neural and behavioral correlates of RPE across a dimensional spectrum of anhedonia and motivated behavior, independent of primary diagnosis.
Participant Ascertainment:
- Recruit participants along a continuum based on scores from the Temporal Experience of Pleasure Scale (TEPS) anticipatory scale and the Snaith-Hamilton Pleasure Scale (SHAPS) [16].
- Include individuals with mood, psychotic, and substance use disorders, as well as healthy controls, without exclusion for comorbidities.
- Stratify participants into high, medium, and low anhedonia groups based on self-report scores.
Experimental Paradigms (Paradigms Unit of Analysis):
- Probabilistic Reward Task: A signal-detection task where correct identification of one stimulus is reinforced more frequently than another. The primary outcome is reward learning bias, a behavioral index of RPE-driven modulation [16].
- Monetary Incentive Delay (MID) Task: During functional MRI (fMRI), participants respond to cues predicting monetary gain or loss. The Blood Oxygen Level Dependent (BOLD) signal in the ventral striatum following reward outcome vs. prediction provides a neural correlate of RPE [16].
Multi-Unit Measurement:
- Circuits/Physiology: fMRI BOLD signal during MID task; electroencephalography (EEG) to measure the feedback-related negativity (FRN) component, a putative electrophysiological marker of RPE.
- Behavior: Response bias in the Probabilistic Reward Task; reaction time changes on the MID task.
- Self-Report: TEPS (anticipatory and consummatory subscales), SHAPS, ecological momentary assessment (EMA) of daily pleasure and motivation.
- Genes: Optional collection of saliva for genotyping polymorphisms in dopaminergic pathway genes (e.g., DRD2, COMT).
Data Integration: Use multivariate statistical models (e.g., canonical correlation, partial least squares) to identify patterns of covariance across neural, behavioral, and self-report units. Test whether these patterns are more strongly associated with the anhedonia dimension than with any specific DSM diagnosis.
Protocol 2: Digital Phenotyping for Real-World Measurement of Constructs
Digital phenotyping leverages smartphones and wearable sensors to capture real-time, real-world data on behavior, physiology, and self-report, aligning perfectly with RDoC's emphasis on multi-unit analysis [24].
Objective: To quantify the Sustained Threat construct (Negative Valence Systems) and its impact on Social Processes and Arousal/Regulatory Systems in a cohort over time.
Platform: A research-grade smartphone application (e.g., Beiwe platform) with companion wearable device (e.g., Empatica E4) [24].
Passive Digital Phenotyping (Behavior/Physiology Units):
- GPS: Location tracking to derive circadian movement (regularity of 24-hour rhythms), location variance (radius of movement), and entropy (randomness of movement), which are markers of avoidance and behavioral withdrawal.
- Accelerometer: Physical activity levels and sleep patterns.
- Audio Recordings (with user consent): Analyzed for prosodic features (e.g., vocal tone, speech rate) as markers of affective state.
- Call and Text Logs (metadata only): Social engagement metrics (number of contacts, interaction frequency).
- Wearable Data: Continuous heart rate, heart rate variability (HRV), and electrodermal activity (EDA) as indices of autonomic arousal and stress response.
Active Digital Phenotyping (Self-Reports/Paradigms Unit):
- Daily Surveys: Brief prompts for self-report of stress, mood, and social interaction.
- Micro-surveys: Randomly delivered, one-item surveys on current anxiety or avoidance urge.
- Cognitive Tasks: Brief, gamified phone-based tasks measuring attention bias (e.g., dot-probe) and cognitive control.
Analysis Pipeline: Time-series data are analyzed for features predictive of self-reported stress and clinician-rated symptoms. Machine learning models (e.g., group-level ridge regression, personalized Hidden Markov Models) are used to identify digital signatures of the Sustained Threat construct and its cross-domain interactions with social withdrawal and arousal dysregulation [24].
The experimental workflow below integrates these traditional and novel methodological approaches within the RDoC matrix structure.
Diagram 2: Experimental Workflow for RDoC-Informed Research [19] [24]
The Scientist's Toolkit: Essential Research Reagent Solutions
Conducting RDoC-aligned research requires access to a suite of tools, assays, and platforms that enable measurement across the specified units of analysis. Below is a non-exhaustive list of key resources.
Table 3: Research Reagent Solutions for RDoC Investigations
| Tool/Resource | Category | Primary Function in RDoC | Example Use Case |
|---|---|---|---|
| NIMH RDoC Matrix [17] | Conceptual Framework | Defines the organizing structure of domains, constructs, and units of analysis. | Foundational reference for designing studies and selecting measurement targets. |
| Monetary Incentive Delay (MID) Task [16] | Experimental Paradigm | Probes neural circuitry of reward anticipation and prediction error (Positive Valence Systems). | fMRI study linking ventral striatum activity to anhedonia dimension. |
| Probabilistic Reward Task [16] | Experimental Paradigm | Measures behavioral reinforcement learning and reward sensitivity. | Quantifying reward learning bias in depression vs. schizophrenia spectrum. |
| Fear Conditioning & Extinction Paradigms [16] | Experimental Paradigm | Probes mechanisms of Acute Threat, Potential Threat, and safety learning (Negative Valence Systems). | Studying fear generalization in anxiety disorders and PTSD. |
| EMOTICOM/CNTRaCS | Cognitive Test Battery | Provides reliable, computerized assessment of multiple cognitive constructs (Cognitive Systems domain). | Profiling cognitive deficits transdiagnostically. |
| Beiwe Research Platform [24] | Digital Phenotyping Platform | Enables collection of active and passive smartphone sensor data for real-world behavior and physiology. | Longitudinal study of social withdrawal (Social Processes) and circadian rhythm (Arousal) in mood disorders. |
| Empatica E4/Whoop Strap | Wearable Biosensor | Continuously measures physiological data (heart rate, HRV, EDA, accelerometry). | Linking autonomic arousal (Arousal/Regulatory Systems) to daily stressors. |
| SeqAPASS Tool [23] | Bioinformatics Tool | Evaluates protein sequence/structural conservation across taxa to infer functional conservation. | Informing the taxonomic domain (tDOA) for a mechanism discovered in rodent models of a construct (e.g., fear conditioning circuits). |
| NIH Toolbox Emotion Battery | Self-Report/Assessment | Includes validated measures for psychological well-being, stress, and social relationships. | Measuring self-reported aspects of Negative Valence and Social Processes domains. |
| Penn Computerized Neurocognitive Battery (CNB) | Cognitive Test Battery | Assesses a wide array of cognitive functions with precise accuracy and reaction time measures. | Mapping performance profiles across diagnostic boundaries to RDoC cognitive constructs. |
Discussion and Future Directions: Integration with Clinical Nosology
The ultimate translational goal of RDoC is to inform a more valid and useful psychiatric nosology. A critical development is the interface between RDoC and the Hierarchical Taxonomy of Psychopathology (HiTOP) [20]. HiTOP is a dimensional classification system derived from the statistical covariation of symptoms, organizing psychopathology into empirically derived spectra (e.g., Internalizing, Thought Disorder) [20]. While RDoC provides a mechanism-focused, bottom-up framework anchored in biology, HiTOP provides a clinically focused, top-down structure of observable psychopathology. The two frameworks are highly complementary: RDoC research can elucidate the neurobiological underpinnings of HiTOP dimensions, and HiTOP can provide well-validated clinical targets for RDoC-based investigations [20].
For example, research can map dysfunction in the Positive Valence Systems domain (an RDoC mechanism) onto the Anhedonia-specific subfactor within HiTOP's Internalizing spectrum [20]. This creates a bidirectional pathway where clinical observations guide mechanistic inquiry, and mechanistic discoveries refine clinical assessment and intervention. Future work will involve large-scale studies that simultaneously collect deep phenotyping data across RDoC units of analysis and detailed symptom assessments to build these integrative maps.
Emerging frontiers in RDoC research include [19] [22]:
- Application to Prevention: Using RDoC constructs to identify at-risk youth and develop targeted, neuroscience-informed preventive interventions (e.g., for substance use disorders) [22].
- Computational Psychiatry: Leveraging formal computational models (e.g., reinforcement learning models) to generate precise, quantitative hypotheses about dysfunction in specific constructs like reward prediction error or cognitive control [19].
- Central-Peripheral Integration: Studying how brain-based circuit dysfunction manifests in peripheral physiology (e.g., immune markers, heart rate variability) to identify accessible biomarkers [19].
In conclusion, the RDoC framework represents a foundational shift towards a biology-based, dimensional, and mechanistic approach to understanding mental disorders. By providing a structure for integrating data across genes, circuits, behavior, and self-report, and by aligning with complementary frameworks like AOP and HiTOP, RDoC charts a course for developing a more precise and actionable taxonomy of neuropsychiatric illness, with direct implications for accelerating drug development and personalizing therapeutic interventions.
Protein structural domains, as fundamental units of evolution, function, and folding, have emerged as critical targets for mechanistic biological research and therapeutic intervention [25]. These conserved units serve as the building blocks for complex protein architectures and are central to molecular recognition, including interactions with drugs and small molecules [26]. The integration of domain-centric analysis with modern frameworks like the Adverse Outcome Pathway (AOP) wiki enhances our ability to systematically link molecular initiating events to adverse biological outcomes, thereby informing chemical risk assessment and targeted drug discovery [27] [28]. This whitepaper provides a technical examination of domain identification methodologies, structural analysis techniques, and the pivotal role of comprehensive databases in mapping domain-ligand interactions. By framing protein domains within the context of AOP-driven taxonomic research, we establish a cohesive strategy for exploiting these evolutionary units as precise, druggable targets.
The Adverse Outcome Pathway (AOP) framework provides a structured model for tracing the cascade of biological events from a molecular initiating event (MIE) to an adverse outcome (AO) at the organism or population level [28]. In this paradigm, protein structural domains are often the physical substrates for MIEs—such as the binding of a toxicant or a therapeutic drug—initiating downstream key events. AOPs are systematically collated in knowledge bases like the AOP-Wiki and the AOP Database (AOP-DB), which facilitate the exploration of relationships between stressors, protein/gene targets, and diseases [27] [28].
Recent mapping of the AOP-Wiki reveals that research is concentrated on areas like genitourinary diseases, neoplasms, and developmental anomalies, while highlighting significant biological and disease gaps that require further study [27]. This underscores the need for precise molecular characterization. Protein domains, as evolutionarily conserved functional units, offer the resolution needed to define these initial interactions with high specificity. Resources like DrugDomain 2.0, which links evolutionary domain classifications (ECOD) to ligand-binding data across the entire Protein Data Bank (PDB), are therefore invaluable for grounding AOPs in structural reality and identifying druggable targets [26]. This guide details the methodologies for identifying and analyzing these domains, their role in ligand interaction, and their integration into pathway-based toxicological and pharmaceutical research.
Identification and Classification of Protein Domains
Protein domains are compact, independently folding units that act as the structural, functional, and evolutionary modules of proteins [25]. Their correct identification is pivotal for protein classification, function prediction, and design. Methods for domain detection are broadly categorized into sequence-based and structure-based approaches, each with distinct advantages.
Table 1: Overview of Protein Domain Identification Method Categories [25]
| Category | Description | Key Principle | Example Tools |
|---|---|---|---|
| Homology-Based | Identifies domains by finding homologous sequences with known domain annotations. | Relies on sequence alignment against template databases (PDB, Pfam). Accuracy is high when templates exist. | CHOP, DomPred, CLADE, ThreaDom |
| Ab Initio (Sequence) | Predicts domain boundaries from sequence alone using statistical or machine learning models. | Learns features differentiating domain cores from linker regions without templates. | DNN-Dom, DeepDom, FuPred, ConDo |
| Structure-Based | Identifies domains from experimentally determined or predicted 3D protein structures. | Detects compact, spatially distinct units within the folded protein. | ISN Analysis, Manual curation in SCOP/CATH |
Homology-based methods utilize databases of known domains. For instance, CHOP performs hierarchical searches against PDB, Pfam-A, and SWISS-PROT to find templates [25]. Ab initio methods have advanced significantly with machine learning. Tools like DNN-Dom use convolutional and recurrent neural networks trained on features like position-specific scoring matrices (PSSM) and predicted secondary structure to predict boundaries [25]. Structure-based classification, as implemented in manual databases like SCOP (Structural Classification of Proteins) and semi-automated systems like CATH, organizes domains into hierarchical classes (e.g., all-α, all-β) based on secondary structure composition and topology [29]. A novel quantitative approach is the Interaction Selective Network (ISN), which uses chemically specific interactions (hydrogen bonds, hydrophobic contacts) between amino acid residues to define a robust network model that can distinguish between domain structural classes [29].
Structural Analysis and Quantitative Description
Quantitative analysis of domain structures is essential for understanding function and facilitating design. Traditional classification based on secondary structure ratios has limitations due to continuous variation and lack of clear boundaries [29]. Network-based approaches offer a more robust solution by representing the entire 3D structure as a mathematical graph.
The Interaction Selective Network (ISN) is a superior coarse-grained model where vertices represent amino acids and links represent specific chemical interactions (e.g., hydrogen bonds, hydrophobic interactions) [29]. This method incorporates information from both main and side chains, unlike simpler models like the Cα network (CAN). Key network parameters, such as the average vertex degree (k) and average clustering coefficient (C), can effectively discriminate between major structural classes like all-α and all-β domains [29].
Table 2: Key Parameters for the Interaction Selective Network (ISN) Model [29]
| Interaction Type | Atom Pairs Defined | Cut-off Distance (Rc) | Role in Network Formation |
|---|---|---|---|
| Hydrogen Bond | Donor and acceptor atoms (N,O) | 3.5 Å | Primary contributor; defines secondary structure geometry. |
| Hydrophobic | Side-chain carbon atoms (in Ala, Val, Leu, Ile, etc.) | 5.0 Å | Primary contributor; stabilizes core packing. |
| Disulfide Bond | Sulfur atoms (S-S) | 2.2 Å | Defines covalent cross-links. |
| Ionic Bond | Charged side-chain atoms (N in Arg/Lys, O in Asp/Glu) | 6.0 Å | Defines electrostatic interactions. |
| Covalent Bond | Consecutive residues in sequence | N/A (sequential connection) | Defines the polypeptide backbone chain. |
The ISN protocol involves calculating these specific interactions from atomic coordinates (e.g., from a PDB file) using the defined distance cut-offs, constructing the network graph, and then computing its topological parameters for analysis and classification [29].
Domains as Functional and Druggable Modules
Domains are the primary mediators of molecular function, including binding to small molecules, nucleic acids, and other proteins. The systematic mapping of these interactions is crucial for drug discovery. The DrugDomain 2.0 database addresses this by providing a comprehensive resource that links evolutionary domain classifications from ECOD to observed ligand-binding events across the PDB [26].
Table 3: Statistics of the DrugDomain 2.0 Database [26]
| Data Category | Count | Description |
|---|---|---|
| Unique UniProt Accessions | 43,023 | Distinct protein sequences annotated. |
| PDB Structures | 174,545 | Experimental structures analyzed. |
| PDB Ligands | >37,000 | Unique small molecules co-crystallized with proteins. |
| DrugBank Molecules | 7,560 | Approved or experimental drugs mapped. |
| PTM-Ligand Associations | >6,000 | Small-molecule interactions linked to post-translational modification sites. |
| PTM-modified Human Models | 14,000+ | AlphaFold models with PTM sites and docked ligands. |
DrugDomain leverages AI-driven predictions from AlphaFold to extend annotations to human drug targets lacking experimental structures, creating a powerful toolkit for in silico screening and target assessment [26]. This allows researchers to ask domain-centric questions: Which domains bind a particular drug scaffold? Are binding sites conserved across homologous domains in different proteins? Such analysis directly informs the design of selective inhibitors and the understanding of potential off-target effects, a key concern in both drug development and toxicological risk assessment within the AOP framework.
Experimental and Computational Protocols
Domain Identification Workflow:
- Input Sequence/Structure: Start with a protein sequence (FASTA) or 3D structure (PDB/mmCIF file).
- Initial Database Search: For a sequence, run a homology-based tool like CHOP or search against Pfam using HMMER [25]. For a structure, query CATH or SCOP.
- Ab Initio Prediction: If no strong homologs are found, use a machine learning predictor like DNN-Dom or DeepDom. Input the sequence to obtain predicted domain boundary residues [25].
- Structure-Based Verification/Refinement: If a 3D model is available (experimental or from AlphaFold), perform structural analysis. This can involve visual inspection in software like PyMOL or ChimeraX, or quantitative analysis using an ISN protocol to identify compact units [29].
- Consensus Decision: Integrate results from multiple methods to assign final domain boundaries.
ISN Construction and Analysis Protocol [29]:
- Data Preparation: Obtain atomic coordinates from a PDB file for the domain of interest.
- Interaction Calculation: Parse the structure to identify all atom pairs fulfilling the chemical interaction criteria listed in Table 2, using the specified distance cut-offs (Rc).
- Network Generation: Construct a graph where each residue is a node. Create edges (links) between residue pairs where one or more qualifying atomic interactions are identified.
- Parameter Computation: Calculate network metrics for the graph, including the average vertex degree (k) and average clustering coefficient (C).
- Classification: Plot the domain's position on a k vs. C scatter plot alongside reference data from known all-α, all-β, α+β, and α/β domains to determine its structural class.
Structure-Function Mapping Protocol (using protti R package) [30]:
- Fetch Structural Data: Use
fetch_pdb()to retrieve metadata and coordinates for a protein of interest, filtering by resolution and experimental method. - Map Functional Data: For experimental data (e.g., peptide interaction regions from mass spectrometry), use
find_peptide_in_structure()to map peptide sequences onto the 3D structure, reconciling UniProt numbering with PDB author numbering. - Analyze Binding Sites: Calculate distances between mapped functional regions and known ligand-binding sites or domain interfaces to infer mechanisms.
- Visualization: Export custom B-factors reflecting functional data to color-code the structure in visualization software (PyMOL, ChimeraX) for intuitive analysis.
Integration with AOP Development and Taxonomic Domains
The AOP framework's utility in risk assessment depends on the precise definition of MIEs, often occurring at specific protein domains. Integrating domain-level data bridges the gap between chemical structure and biological outcome.
AOP-Domain Integration Workflow: A stressor (e.g., a chemical) is identified to bind a specific protein domain (MIE). Resources like DrugDomain 2.0 can verify this interaction and list homologous domains in other proteins, predicting potential off-target MIEs [26]. The AOP-DB can then be queried with the gene or protein name to find all AOPs where this target is a Key Event, revealing potential adverse outcome pathways [28]. Conversely, starting from an AOP of interest (e.g., for liver fibrosis), one can extract the molecular targets for the MIE and early KEs, use DrugDomain to identify their constituent ligand-binding domains, and screen for chemicals that interact with these domains to populate the "stressor" information [27] [28].
A critical aspect of AOP development is defining the Taxonomic Domain of Applicability—the range of species for which the pathway is biologically plausible. Protein domain conservation is a core line of evidence here. If the structure and sequence of the domain mediating the MIE are highly conserved across mammals, the AOP's domain of applicability is broad. If the domain is unique to a certain taxon, the applicability is restricted [31]. Structural comparison of domains, facilitated by databases like ECOD and CATH, therefore provides empirical evidence to support or limit the taxonomic scope of an AOP.
Diagram 1: AOP-Domain Integration Workflow This diagram illustrates how protein domain data and AOP knowledge bases interact to inform pathway development and define taxonomic applicability.
Future Directions: AI-Driven Design and Safety Assessment
The field is being transformed by AI-driven de novo protein design, which creates novel functional modules not limited by evolutionary history [32]. Tools like RFdiffusion (for backbone generation) and ProteinMPNN (for sequence design) enable the creation of domains with tailored functions, such as high-affinity binding or enzymatic activity [32]. This has profound implications for both therapeutic design and safety assessment.
In therapeutics, this allows engineering of protein drugs, enzymes, and biosensors with desired properties. In toxicology, it raises new questions for AOP development and risk assessment: What are the potential hazards of novel, non-natural protein domains entering biological systems? Robust biosafety assessment frameworks are needed to evaluate risks like immune reactivity or unintended interactions with native biological pathways [32]. The integration of closed-loop validation—where AI designs are experimentally tested and results fed back to improve models—coupled with multi-omics profiling will be essential for the comprehensive risk assessment of these novel biological entities [32].
The Scientist's Toolkit: Research Reagent Solutions
Table 4: Key Resources for Protein Domain and AOP Research
| Resource Name | Type | Primary Function | Access/Reference |
|---|---|---|---|
| DrugDomain 2.0 | Database | Maps evolutionary domains (ECOD) to ligands/drugs across the PDB; includes AlphaFold predictions. | https://drugdomain.cs.ucf.edu/ [26] |
| AOP-DB (EPA) | Database | Integrates AOP information with genes, chemicals, diseases, and pathways for computational analysis. | https://www.epa.gov/healthresearch/aop-db [28] |
| AlphaFold Protein Structure Database | Prediction Database | Provides highly accurate predicted protein structures for the proteome, useful for domains lacking experimental data. | https://alphafold.ebi.ac.uk/ [26] [30] |
| protti R Package | Software Package | Facilitates fetching and analyzing PDB/AlphaFold data, mapping functional peptides onto structures. | https://cran.r-project.org/package=protti [30] |
| RFdiffusion & ProteinMPNN | AI Design Software | Suite for de novo protein backbone generation and sequence design for novel functions. | [32] |
| ISN Analysis Scripts | Computational Protocol | Custom scripts to construct Interaction Selective Networks from PDB files for structural classification. | Methodology described in [29] |
Diagram 2: ISN Experimental Workflow This diagram outlines the step-by-step computational process for constructing and analyzing an Interaction Selective Network from a protein domain structure.
Operationalizing Domain Classification: Tools, Databases, and Research Pipelines
Molecular Phylogenetics and Genomic Tools for Determining Organismal Domains
This technical guide examines the integration of molecular phylogenetics and modern genomic tools for the precise determination of organismal domains, framed within the advancing paradigm of Adverse Outcome Pathway (AOP) research. Molecular phylogenetics, the study of evolutionary relationships through molecular data, provides the foundational framework for classifying life into the three domains: Bacteria, Archaea, and Eukarya [33]. The subsequent development of high-throughput sequencing and bioinformatics has revolutionized this field, enabling phylogenomic analyses that resolve deep evolutionary branches with unprecedented accuracy [34]. Concurrently, the AOP framework, a structured model connecting a molecular initiating event to an adverse outcome at the organism level, is increasingly dependent on precise taxonomic and evolutionary context for reliable application in toxicology and drug development [21] [35]. This whitepaper details the core principles, computational tools, and experimental protocols that bridge phylogenetic analysis with AOP development, offering researchers a roadmap for leveraging genomic data to understand the taxonomic domain-specificity of biological pathways and stressor responses.
Theoretical Foundations: From Taxonomy to Phylogenomics
The systematic classification of organisms is grounded in taxonomy, a discipline formalized by Carl Linnaeus in the 18th century [33]. His hierarchical system (Domain, Kingdom, Phylum, Class, Order, Family, Genus, Species) organized life based on shared morphological characteristics. This logical classification later provided the scaffold for phylogeny—the study of evolutionary history and relationships among organisms [36]. The central premise of molecular phylogenetics is that genomes accumulate mutations over time; consequently, the degree of molecular difference between two organisms is a measure of the time elapsed since they shared a common ancestor [36].
The modern tree of life is divided into three primary domains, a classification superior to the older kingdom-level system:
- Bacteria: Single-celled prokaryotes without a nucleus.
- Archaea: Single-celled prokaryotes, often extremophiles, with distinct biochemical pathways from bacteria.
- Eukarya: Organisms with cells containing a membrane-bound nucleus, encompassing kingdoms like Protista, Fungi, Plantae, and Animalia [33].
Molecular data surpassed morphology as the primary source for phylogenetic inference due to three key advantages: the ability to generate large, unambiguous datasets (e.g., every nucleotide in a sequence is a character), the precise and discrete nature of character states (A, C, G, T), and the ease of conversion to numerical form for statistical analysis [36]. Early molecular methods included immunological assays, protein electrophoresis, and DNA-DNA hybridization [36]. The field was revolutionized by direct DNA sequencing, as DNA provides greater phylogenetic information content than protein, includes non-coding regions, and is easily amplified via PCR [36].
A critical distinction in modern analysis is between a gene tree (the evolutionary history of a particular gene) and a species tree (the evolutionary history of the organisms). These can differ due to processes like gene duplication, loss, and horizontal gene transfer, necessitating careful selection of genetic markers and analytical methods [36] [34]. The current state-of-the-art is phylogenomics, which uses hundreds to thousands of genes, often derived from whole-genome sequences, to reconstruct robust phylogenetic trees [34].
Table 1: Hierarchical Taxonomic Classification (Exemplified by the Hawaiian Goose, Branta sandvicensis) [33]
| Taxon Level | Classification | Key Defining Characteristics |
|---|---|---|
| Domain | Eukarya | DNA contained within a membrane-bound nucleus. |
| Kingdom | Animalia | Organism must consume other organisms for energy. |
| Phylum | Chordata | Possesses a notochord, dorsal nerve cord, and pharyngeal slits. |
| Class | Aves | Has feathers and hollow bones. |
| Order | Anseriformes | Waterfowl with webbed front toes. |
| Family | Anatidae | Swans, ducks, and geese; broad bill, keeled sternum. |
| Genus | Branta | Black geese with bold plumage, black bill and legs. |
| Species | sandvicensis | Specific to the Hawaiian Islands (nēnē). |
The Genomic Toolkit: Databases, Algorithms, and AI
The explosion of genomic data has been matched by the development of sophisticated public databases and computational tools essential for phylogenetic and AOP research.
Core Molecular Databases: Researchers must navigate a complex ecosystem of databases. Nucleic acid sequences are primarily housed in NCBI GenBank, EMBL-EBI, and DDBJ, which form the International Nucleotide Sequence Database Collaboration (INSDC). For protein sequences and rich functional annotation, UniProt is the central resource [37]. Specialized databases cater to specific needs: Ensembl and UCSC Genome Browser for vertebrate genomics and comparative analysis; Pfam and InterPro for protein domain classification; and KEGG and Reactome for pathway information [37] [38].
Analysis Software and Algorithms: Phylogenetic reconstruction is a multi-step computational process. It begins with multiple sequence alignment using tools like Clustal Omega or MAFFT. Evolutionary models are then selected, and trees are built using methods such as:
- Maximum Likelihood (ML): Finds the tree that makes the observed data most probable under a given evolutionary model (e.g., RAxML, IQ-TREE).
- Bayesian Inference (BI): Uses Markov chain Monte Carlo (MCMC) to estimate the posterior probability of trees (e.g., MrBayes, BEAST2) [38].
- Distance-based Methods: Use genetic distances to build trees (e.g., Neighbor-Joining), often faster but less sophisticated than ML or BI.
For sequence similarity searching—a routine task in identifying homologous genes for phylogenetic analysis—the Basic Local Alignment Search Tool (BLAST) is indispensable [39].
The Rise of AI in Genomics: A transformative advancement is the application of large-scale artificial intelligence models trained on genomic data. Evo 2, developed by the Arc Institute, is a foundational AI model trained on over 9.3 trillion nucleotides from more than 128,000 genomes across all domains of life [40]. This model can detect deep evolutionary patterns, predict the functional impact of genetic variants (e.g., distinguishing pathogenic from benign mutations in the BRCA1 gene with >90% accuracy), and even assist in designing functional genetic elements [40]. Such tools promise to accelerate the discovery of evolutionarily conserved sequences and domains critical for AOP development.
Table 2: Selected Public Databases for Phylogenetic and AOP Research [37] [38]
| Database Name | Type | Primary Utility in Phylogenetics/AOP | URL/Resource |
|---|---|---|---|
| GenBank / NCBI | Nucleotide Sequences | Primary repository for DNA sequences; integrated with analysis tools like BLAST. | https://www.ncbi.nlm.nih.gov/ |
| UniProt | Protein Sequences & Annotation | Authoritative resource for protein function, structure, and classification. | https://www.uniprot.org/ |
| Ensembl | Genome Browser | Comparative genomics, gene homology identification, and variant analysis for vertebrates. | https://www.ensembl.org |
| Pfam / InterPro | Protein Domains | Identifying conserved protein domains and families to infer function and evolutionary history. | http://pfam.xfam.org/ |
| AOP-Wiki | Adverse Outcome Pathways | Central repository for curated AOPs, linking molecular events to adverse outcomes. | https://aopwiki.org/ |
| STRING | Protein-Protein Interactions | Predicting functional associations between proteins, informing Key Event Relationships. | https://string-db.org |
Integration with the AOP Framework
The Adverse Outcome Pathway (AOP) framework provides a structured, modular representation of the sequence of measurable biological events linking a Molecular Initiating Event (MIE)—the initial interaction of a stressor with a biomolecule—to an Adverse Outcome (AO) relevant to risk assessment [21]. The connection between phylogenetics and AOPs is profound and bidirectional.
Taxonomic Domain Applicability (Life Stage, Sex, Taxonomy): A fundamental principle in AOP development is defining the taxonomic applicability of the pathway. An AOP developed in a model organism (e.g., a fish) may not be directly relevant to humans if the targeted molecular pathway is not evolutionarily conserved [21]. Molecular phylogenetics provides the tools to assess this conservation. By analyzing the evolutionary history of the genes and proteins involved in the MIE and subsequent Key Events (KEs), researchers can predict which taxa are likely susceptible to the same AOP. This directly addresses the AOP Developer's Handbook guidance on defining the "life stage, sex, and taxon" for which an AOP is relevant [21].
Informing Key Event Relationships (KERs): The biological plausibility of a Key Event Relationship (KER)—the causal link between an upstream and downstream KE—can be strengthened by evolutionary evidence. If two interacting proteins (e.g., a receptor and its transcription factor target) show a pattern of co-evolution across diverse species, it provides strong support for the existence and importance of that functional link within an AOP [34].
AOP Networks and Phylogenomic Mapping: Modern AOP research moves beyond linear pathways to interconnected AOP Networks (AOPNs). Computational tools like AOPWIKI-EXPLORER leverage graph databases and natural language processing to allow researchers to query complex relationships within the AOP knowledgebase [41]. Integrating phylogenomic data into such networks can reveal, for instance, that a particular MIE (e.g., binding to a nuclear receptor) is associated with divergent AOs in different taxonomic clades due to lineage-specific evolution of downstream pathway components. A 2024 analysis of the AOP-Wiki found that AOPs related to genitourinary diseases, neoplasms, and developmental anomalies are most prevalent, highlighting areas where understanding taxonomic specificity is crucial for human health risk assessment [35].
Diagram 1: Integrated Phylogenetic and AOP Analysis Workflow. This workflow illustrates how genomic data and AOP knowledge are processed to infer the taxonomic domain applicability of molecular pathways. The decision node ("Conserved MIE?") represents the critical point of integration where evolutionary conservation informs AOP relevance.
Experimental & Computational Protocols
Protocol for Constructing a Phylogenetic Tree
This protocol outlines a standard workflow for gene-based phylogenetic analysis to determine evolutionary relationships [37].
Sequence Acquisition:
- Identify Target Gene/Protein: Choose a well-conserved, informative marker (e.g., 16S rRNA for prokaryotes, CO1 for animals, or a set of universal single-copy orthologs for phylogenomics).
- Retrieve Sequences: Use NCBI BLAST [39] or the Batch Entrez tool to find homologs. Download sequences in FASTA format. Include an outgroup—a sequence known to be outside the clade of interest to root the tree [36].
- Database Mining: For large-scale studies, use BioMart (Ensembl) or ID mapping (UniProt) to batch-download sequences and annotations [37].
Multiple Sequence Alignment (MSA):
- Align sequences using tools like Clustal Omega (via UniProt or standalone) or MAFFT to identify homologous positions.
- Manually inspect and refine the alignment, trimming poorly aligned regions or gaps.
Model Selection and Tree Reconstruction:
- Use software like ModelTest-NG or IQ-TREE's built-in function to find the best-fit nucleotide or amino acid substitution model.
- Construct the tree using a robust method:
- Maximum Likelihood: Execute using RAxML or IQ-TREE. Perform bootstrap analysis (e.g., 1000 replicates) to assess branch support.
- Bayesian Inference: Run MrBayes or BEAST2 for a specified number of generations, checking for convergence. Bayesian Posterior Probabilities provide branch support [38].
Tree Visualization and Interpretation:
- Visualize the final tree using FigTree, iTOL, or ggtree in R.
- Interpret the topology: closely related species cluster together on shared branches. The root, defined by the outgroup, indicates the direction of evolution [36].
Protocol for Assessing AOP Conservation Across Taxa
This protocol leverages phylogenetic tools to evaluate the taxonomic domain applicability of an AOP.
Identify AOP Core Components:
Perform Phylogenetic Footprinting:
- For each core gene/protein, retrieve its orthologs across a broad range of taxa using OrthoDB or Ensembl Compara [38].
- Construct a gene tree for each component following the protocol in Section 4.1.
Analyze Evolutionary Conservation:
- Map the presence/absence of the gene ortholog onto a reference species tree (e.g., from the Open Tree of Life project).
- Assess sequence conservation of critical functional domains (e.g., ligand-binding pocket for a receptor MIE) using Pfam and alignment visualization [37].
- Utilize AI models like Evo 2 to predict whether a key genetic variant in a non-model organism would be likely to disrupt the function of the AOP's core component [40].
Define Applicability Domain:
- Synthesize results to state the AOP's predicted relevance. For example: "This AOP for aryl hydrocarbon receptor (AhR) activation leading to developmental toxicity is supported for all vertebrate taxa, as the AhR DNA-binding domain is highly conserved from fish to mammals. It is not predicted to be applicable to insects, which lack a true AhR ortholog."
Table 3: Comparison of Phylogenetic Reconstruction Methods
| Method | Core Principle | Key Advantages | Limitations / Considerations | Common Software |
|---|---|---|---|---|
| Maximum Likelihood (ML) | Finds the tree topology and branch lengths that maximize the probability of observing the aligned sequence data. | Statistically robust; provides branch support via bootstrapping; works well with complex models. | Computationally intensive for large datasets. | RAxML, IQ-TREE, PhyML |
| Bayesian Inference (BI) | Uses Bayes' theorem to compute the posterior probability distribution of trees, given the sequence data and a prior model. | Provides direct probabilistic support for branches (Posterior Probabilities); incorporates prior knowledge. | Very computationally intensive; requires careful assessment of convergence. | MrBayes, BEAST2 |
| Distance-Based (Neighbor-Joining) | Clusters sequences based on a pairwise genetic distance matrix. | Extremely fast; simple to implement. | Less statistically rigorous than ML or BI; does not use individual site information. | MEGA, PHYLIP |
The Scientist's Toolkit: Essential Research Reagent Solutions
This table details critical non-computational resources for conducting integrated phylogenetic and AOP-focused research.
Table 4: Research Reagent Solutions for Phylogenetic and AOP Studies
| Item / Resource | Function / Description | Relevance to Domain Determination & AOPs |
|---|---|---|
| Universal PCR Primers | Sets of oligonucleotide primers designed to amplify conserved gene regions (e.g., 16S rRNA, 18S rRNA, CO1) from diverse taxa. | Enables amplification of phylogenetic marker genes from unknown or non-model organisms, providing the raw data for domain placement. |
| Whole-Genome Amplification Kits | Kits for amplifying minute quantities of genomic DNA from single cells or environmental samples. | Allows genomic sequencing of unculturable Archaea or Bacteria, expanding the reference tree of life and discovering novel lineages. |
| Phylogenetically Diverse Cell Lines | Curated collections of cultured cells from a broad range of eukaryotic species (e.g., ATCC). | Provides in vitro systems for empirically testing the taxonomic applicability of an AOP's MIE or KEs in a controlled, comparative manner. |
| Protein Domain-Specific Antibodies | Antibodies raised against conserved epitopes within functional protein domains (e.g., kinase domains, DNA-binding domains). | Used to detect the presence and conservation of AOP-related proteins (KEs) across tissue samples from different species via Western blot or IHC. |
| Crispr-Cas9 Gene Editing Systems | Tools for targeted gene knockout or knock-in in a wide variety of model and non-model organisms. | Enables essentiality testing of a KE in vivo; knocking out an ortholog in a fish model can test if an AOP conserved from mammals is still functional. |
| AOP-Wiki Database | The central, crowdsourced repository for AOPs, endorsed by the OECD [21]. | The primary resource for finding existing AOPs, identifying shared KEs, and understanding the current evidence for pathway conservation. Not a physical reagent, but a foundational knowledge reagent. |
Diagram 2: AOP Activation Governed by Phylogenetic Conservation. This diagram conceptualizes how phylogenetic grouping dictates the applicability of an AOP. The linear cascade of MIE, KEs, and AO proceeds only in taxonomic groups where the molecular target of the MIE is evolutionarily conserved (Groups A & B). In Group C, where the target is absent, the pathway is not applicable, a critical determination for accurate risk assessment.
The convergence of molecular phylogenetics, genomic tools, and the AOP framework represents a powerful synergy for 21st-century bioscience. Future progress will be driven by several key trends:
- Ubiquitous AI Integration: Foundational models like Evo 2 will become routine tools for predicting functional conservation and designing experiments to test AOP applicability across taxa [40].
- Real-Time Phylogenomic AOP Mapping: Tools like AOPWIKI-EXPLORER will evolve to directly integrate with genomic browsers, allowing researchers to click on a gene in a phylogenetic tree and instantly see all AOPs in which it participates [41].
- Single-Cell and Metagenomic Expansion: Phylogenetic classification is moving beyond pure cultures to complex communities via metagenomics. This will allow AOP development for microbiomes and their interactions with host organisms, crucial for understanding endocrine disruption or immunotoxicity [35].
- Quantitative Evolutionary Toxicology: The field will develop formal models to quantify how the strength of a KER (its kinetic and dynamic parameters) evolves across phylogenetic distance, moving beyond qualitative "applicable/not applicable" statements.
In conclusion, determining organismal domains is no longer a static exercise in classification but a dynamic, data-rich process integral to predictive biology. For researchers and drug development professionals, leveraging phylogenetic tools to ground AOPs in an evolutionary context is essential. It ensures that mechanistic toxicology and efficacy studies are conducted in biologically relevant models, de-risks the extrapolation of findings across species, and ultimately leads to more precise and reliable safety assessments for chemicals and therapeutics. The integration of these disciplines, facilitated by the open data and tools highlighted in this guide, is foundational to a more predictive and mechanistic understanding of biology across all domains of life.
The classification of mental disorders has long relied on categorical systems like the DSM and ICD, which group conditions based on symptom clusters [42]. While providing a common language, these systems face significant limitations, including high comorbidity, clinical heterogeneity, and a lack of validated biomarkers, which impede the discovery of underlying mechanisms and the development of targeted treatments [43] [44]. In response, the National Institute of Mental Health (NIMH) launched the Research Domain Criteria (RDoC) initiative, a translational research framework designed to reframe psychopathology research by studying disruptions in normal neurobehavioral systems [19].
The core translational challenge is linking findings across vastly different scales of biological organization—from genes and molecules to circuits, physiology, and ultimately, observable behavior and self-reported experience. The RDoC matrix is the central tool designed to address this challenge [45]. It organizes research around continuous, dimensional constructs of brain-behavior function (e.g., reward learning, acute threat) and encourages investigators to measure these constructs across multiple, parallel units of analysis, from genes to behavior [46] [19]. This multi-level approach aims to build a more precise, biologically grounded understanding of mental disorders, moving from descriptive syndromes to dysfunctions in specific, measurable systems [44].
This technical guide details the methodology for utilizing the RDoC matrix to translate constructs across its units of analysis. It is framed within the broader context of mechanistic framework development, drawing explicit parallels to the Adverse Outcome Pathway (AOP) framework used in toxicology. Both frameworks share the goal of constructing causal, knowledge-based pathways from molecular perturbations to organism-level outcomes, offering complementary lessons for defining taxonomic domains and establishing weight of evidence [21] [23].
The RDoC Framework: Structure and Core Principles
The RDoC framework is built upon a set of foundational principles, or "pillars," that guide its application [19]. These pillars are: (1) starting with translational understanding from basic science on normative function; (2) assuming a dimensional approach from normal to abnormal; (3) incorporating multiple units of analysis; (4) using paradigms from experimental psychology to measure constructs; (5) seeking neurodevelopmental perspectives; (6) considering environmental influences; and (7) employing computational models to integrate complex data [19].
The Matrix: Domains, Constructs, and Units of Analysis
The operationalization of these principles occurs through the RDoC matrix. The matrix is organized into rows and columns. The rows represent major domains of human psychological functioning, each containing several specific constructs and subconstructs [45] [44].
Table 1: RDoC Domains and Selected Constructs
| Domain | Primary Function | Example Constructs |
|---|---|---|
| Negative Valence Systems | Response to aversive stimuli/contexts [44] | Acute Threat ("Fear"), Potential Threat ("Anxiety"), Sustained Threat, Loss, Frustrative Nonreward [45] |
| Positive Valence Systems | Response to positive motivational situations [43] | Reward Responsiveness, Reward Learning, Reward Valuation, Habit [45] |
| Cognitive Systems | Cognitive processes [45] | Attention, Perception, Declarative Memory, Language, Cognitive Control, Working Memory [45] |
| Systems for Social Processes | Interpersonal responses, social communication [43] | Affiliation and Attachment, Social Communication, Perception and Understanding of Self/Others [45] |
| Arousal/Regulatory Systems | Regulation of arousal and circadian rhythms [43] | Arousal, Circadian Rhythms, Sleep-Wakefulness [45] |
| Sensorimotor Systems | Control of motor behavior [43] | Motor Actions, Agency and Ownership, Habit [45] |
The columns of the matrix represent the different units of analysis. These are the levels at which a given construct can be measured, forming the core pathway for translational investigation [45] [19].
Table 2: RDoC Units of Analysis and Measurement Modalities
| Unit of Analysis | Definition & Purpose | Example Measurement Modalities |
|---|---|---|
| Genes | Identify genetic variations associated with variation in a construct [45]. | GWAS, candidate gene studies, sequencing (e.g., in genetic syndromes like PWS [43]). |
| Molecules | Measure molecular players (e.g., neurotransmitters, hormones) implicated in the construct [45]. | Immunoassays (e.g., ghrelin in PWS [43]), receptor binding assays, metabolomics. |
| Cells | Assess relevant cell types and their functions [45]. | In vitro cell models, immunohistochemistry, electrophysiology in cell cultures. |
| Circuits | Define and measure the neural circuits that implement the construct [45]. | fMRI, EEG/MEG, PET, optogenetic/chemogenetic manipulation in animal models. |
| Physiology | Measure peripheral physiological correlates of the construct [45]. | Heart rate variability, skin conductance, eye-tracking, startle reflex. |
| Behavior | Quantify observable actions related to the construct [45]. | Behavioral tasks from experimental psychology (e.g., threat paradigms [47]), actigraphy. |
| Self-Reports | Capture the subjective, experiential aspect of the construct [45]. | Validated questionnaires, ecological momentary assessment, structured interviews [47]. |
| Paradigms | The experimental methods used to elicit and measure the construct across units [45]. | Emotional Faces Task [47], fear conditioning, reward learning tasks. |
Methodology for Translational Integration Across Units
Successfully utilizing the RDoC matrix requires a strategic, multi-method research approach. The following section outlines the core methodological workflow and provides detailed experimental protocols.
Core Translational Workflow
The process begins with the selection of a specific RDoC construct (e.g., "Acute Threat") as the independent variable, rather than a DSM diagnosis [47] [19]. Researchers then design a study to measure this construct simultaneously or in a linked manner across at least two, but ideally more, units of analysis. The goal is to establish converging evidence and specific associations between variables at different levels [46] [19].
Detailed Experimental Protocols
Protocol 1: Translating a Genetic Disorder into RDoC Constructs (Exemplified by Prader-Willi Syndrome) This protocol uses a well-defined genetic condition to inform the RDoC matrix, particularly at the "Genes" unit [43].
- Construct Selection & Rationale: Identify a genetic disorder with robust psychiatric manifestations, such as Prader-Willi Syndrome (PWS). PWS results from the loss of paternally expressed genes on chromosome 15q11-q13 and features phenotypes relevant to multiple RDoC domains, including hyperphagia (Positive Valence) and social deficits (Social Processes) [43].
- Gene-to-Circuit Linkage:
- MIE/Genetic Anchor: Define the molecular initiating event (MIE) as the absence of paternal expression of genes in the PWS locus (e.g., SNORD116, MAGEL2) [43].
- Molecular & Physiological Measurement: In human patients or knockout mouse models, measure downstream molecular perturbations. For PWS, this includes elevated circulating proghrelin/ghrelin levels using immunoassays [43].
- Circuit & Behavior Assessment: Link molecular changes to circuit function. Hyperghrelinemia is hypothesized to alter dopaminergic reward circuit activity. Measure behavioral output using food reward-seeking tasks and ad libitum food consumption tests, demonstrating excessive motivation for and consumption of food [43].
- Data Integration: The pathway is mapped as: PWS Locus Deletion (Genes) → Elevated Ghrelin (Molecules) → Altered Reward Circuit Activity (Circuits) → Hyperphagia (Behavior). This provides empirical data to populate the "Positive Valence Systems" domain of the RDoC matrix [43].
Protocol 2: Differentiating RDoC Constructs in a Clinical Population (Acute vs. Potential Threat in Pediatric Anxiety) This protocol demonstrates how to empirically distinguish related RDoC constructs within a clinically relevant population [47].
- Construct Operationalization: Define the constructs "Acute Threat" (AT; fear of immediate danger) and "Potential Threat" (PT; anxiety about future uncertain danger) at the self-report and neurocircuit levels [47].
- Participant Ascertainment: Recruit youth across a continuum of anxiety severity, using both categorical diagnoses and dimensional severity ratings (e.g., Pediatric Anxiety Rating Scale) [47].
- Multi-Level Measurement:
- Self-Report: Derive AT and PT factor scores from existing anxiety questionnaires, using expert consensus to classify items [47].
- Behavior & Physiology via Paradigm: Use the Emotional Faces Shifted Attention Task (EFSAT) during fMRI. This paradigm engages threat-responsive neural circuits. Physiological and behavioral responses (reaction time, accuracy) are recorded concurrently [47].
- Circuit Measurement: Analyze fMRI BOLD signal in a priori regions of interest (e.g., amygdala, insula) during threat vs. neutral face conditions [47].
- Statistical Integration: Test associations between self-report factor scores (AT, PT) and neural activation. A key finding from this protocol was that AT scores, but not PT scores, positively predicted right posterior insula activation to threat faces, providing discriminant validity for these constructs at the circuit level [47].
Integration with the AOP Framework and Taxonomic Domains
The RDoC framework shares significant conceptual and structural parallels with the Adverse Outcome Pathway (AOP) framework used in toxicology and ecotoxicology [21] [23]. Both are knowledge-organizing frameworks that describe sequential, measurable events leading from an initial perturbation to a functional outcome.
Structural Alignment: From MIE to AO vs. Genes to Behavior
- AOP Structure: An AOP begins with a Molecular Initiating Event (MIE) (e.g., chemical binding to a receptor), proceeds through intermediate Key Events (KEs) at different biological levels, and culminates in an Adverse Outcome (AO) relevant to risk assessment [21].
- RDoC Alignment: An RDoC investigation can be viewed as exploring a pathway from a genetic or molecular perturbation (analogous to an MIE) through circuit and physiological changes (KEs) to a behavioral or self-reported phenotype (analogous to an AO relevant to mental health) [43].
- Modularity: Both frameworks emphasize modularity. In AOPs, KEs and KE Relationships (KERs) are designed to be reusable across different pathways [21]. Similarly, RDoC constructs and their associated measurement paradigms are intended to be transdiagnostic, applicable across traditional disorder categories [42].
Defining the Taxonomic Domain of Applicability (tDOA)
A critical challenge for both frameworks is defining the taxonomic domain of applicability (tDOA)—the range of species or populations for which the described pathway is valid [23]. In toxicology, bioinformatics tools like SeqAPASS are used to assess the conservation of proteins (e.g., receptors) across species to infer if an AOP is plausible in untested taxa [23].
This approach is directly relevant to RDoC. For example, the conservation of reward-related genes and neural circuits from rodents to humans supports the translational use of animal models to study the "Positive Valence Systems" domain [19]. Explicitly considering tDOA in RDoC research involves:
- Assessing the evolutionary conservation of implicated genes, neural structures, and behaviors.
- Acknowledging species-specific limitations (e.g., the human capacity for self-report).
- Using cross-species alignment to strengthen the biological plausibility of proposed construct-measurement relationships.
Table 3: Key Research Reagent Solutions and Resources
| Resource Name | Type | Primary Function in RDoC/AOP Research | Source/Access |
|---|---|---|---|
| RDoC Matrix | Knowledge Framework | Provides the official catalog of domains, constructs, and units of analysis to design and categorize studies. | NIMH Website [45] |
| AOP-Wiki | Collaborative Knowledge Base | The central repository for developing, sharing, and assessing Adverse Outcome Pathways; a model for organizing mechanistic knowledge. | https://aopwiki.org/ [21] [27] |
| SeqAPASS Tool | Bioinformatics Tool | Predicts chemical susceptibility and assesses structural conservation of proteins across species to help define tDOA for AOPs/RDoC-aligned pathways. | U.S. EPA [23] |
| MATRICS/CNTRICS Measures | Cognitive & Behavioral Paradigms | Provide validated neurocognitive and behavioral tasks (paradigms) for measuring constructs like working memory or social cognition. | NIMH Initiatives [44] |
| Human & Animal Knockout/Mutant Models | Biological Model | Provide a direct link from specific genetic perturbations (Genes unit) to multi-level phenotypes, essential for testing causal pathways. | (e.g., PWS, Magel2-KO mice [43]) |
| fMRI/EEG/Physiology Suites | Measurement Apparatus | Enable the non-invasive measurement of neural circuit activity (Circuits unit) and peripheral physiology (Physiology unit) in living organisms. | Core research facilities |
Utilizing the RDoC matrix effectively requires a shift from a diagnosis-centric to a construct-centric research paradigm. By systematically translating constructs across units of analysis—from genes to behavior—researchers can build a more mechanistic, dimensional, and biologically grounded understanding of psychopathology. The integration of principles from the AOP framework, particularly regarding modular knowledge assembly and the definition of taxonomic domains, provides a powerful complementary structure for strengthening the validity and applicability of RDoC-based findings.
Future progress will depend on the continued development and sharing of standardized, cross-species measurement paradigms, the application of computational models to integrate multi-level data, and the explicit consideration of neurodevelopmental trajectories and environmental interactions within the matrix framework [19]. The ultimate goal is a functional nosology for mental disorders that is rooted in brain-behavior relationships, directly informs targeted intervention strategies, and is guided by the systematic, translational science exemplified by the RDoC matrix.
The identification and validation of molecular targets constitute the foundational step in modern drug discovery and toxicological risk assessment. Within the Adverse Outcome Pathway (AOP) framework—a structured representation linking a Molecular Initiating Event (MIE) at the molecular level to an Adverse Outcome (AO) at the organism or population level—precise target identification is critical for defining the initial biological perturbation [21]. The AOP framework organizes mechanistic knowledge to support chemical safety assessment, and its utility is magnified when the taxonomic domain of applicability (tDOA) is clearly defined [23].
Structural domain databases—ECOD (Evolutionary Classification of protein Domains), SCOP (Structural Classification of Proteins), and CATH (Class, Architecture, Topology, Homologous superfamily)—provide the essential three-dimensional fossil record of protein evolution [48]. They classify protein domains, the conserved structural, functional, and evolutionary units within proteins, into hierarchical systems based on folding patterns and evolutionary relationships. This review posits that the strategic integration of these structural classification resources is indispensable for advancing AOP-informed research, particularly for cross-species extrapolation, mechanistic understanding, and target identification for both drugs and toxicants. By mapping a chemical stressor's interaction to a specific protein domain within a classified superfamily, researchers can predict potential MIEs, infer biological plausibility across taxa, and systematically identify novel targets for therapeutic intervention or hazard assessment.
Comparative Analysis of Core Structural Domain Databases
The databases ECOD, SCOP, and CATH share the common goal of classifying protein structural domains but differ in their underlying philosophies, hierarchical principles, and curation methodologies. These differences inform their optimal application in target identification workflows.
Classification Hierarchies and Philosophical Approaches
Table 1: Hierarchical Classification Levels in ECOD, SCOP, and CATH.
| Database | Primary Classification Levels (Top to Bottom) | Core Classification Philosophy |
|---|---|---|
| ECOD | Architecture (A) → Possible Homology (X) → Homology (H) → Topology (T) → Family (F) [49] | Evolution-centric. Aims to group domains by common ancestry, even if topological similarity is low (e.g., due to structural drift). The "X-group" explicitly acknowledges uncertain homology [49]. |
| SCOP | Class → Fold → Superfamily → Family → Protein Domain → Species [50] | Manual curation-centric. Emphasizes evolutionary relationships inferred from a combination of structural and sequence similarity. "Fold" groups proteins with similar major secondary structure arrangement and connectivity, which may arise from convergent evolution [50]. |
| CATH | Class (C) → Architecture (A) → Topology (T) → Homologous superfamily (H) [48] [51] | Structure-centric. Separates the general arrangement of secondary structures (Architecture) from their specific connectivity (Topology) before assigning evolutionary kinship (Homologous superfamily) [48]. |
ECOD prioritizes evolutionary relationships, sometimes grouping domains with different topologies into the same Homology (H) group if evidence suggests a common ancestor [49]. SCOP, traditionally relying heavily on expert judgment, creates a clear distinction between "Fold" (similar structure, not necessarily common origin) and "Superfamily" (probable common evolutionary origin) [50]. CATH introduces the Architecture level, describing the overall shape and orientation of secondary structures independent of their connections, a level not explicitly defined in SCOP or ECOD [48].
Data Characteristics, Curation, and Coverage
Table 2: Current Data Characteristics and Curation Models.
| Database | Representative Version/Stats | Primary Curation Model | Key Integrations & Features |
|---|---|---|---|
| ECOD | Regularly updated. Used in DrugDomain 2.0 (43,023 UniProt accessions, 174,545 PDB structures) [26]. | Hybrid (Automated pipeline + expert manual curation). Manual intervention for novel folds, multi-domain proteins, and ambiguous cases [49]. | Integrated with DrugDomain for domain-ligand interactions. Includes AlphaFold models. Focus on capturing distant homology [26] [49]. |
| SCOP | SCOP 1.75 (110,800 domains; manual, discontinued). SCOPe 2.07 (276,231 domains; hybrid) [50]. | Historically manual; SCOPe continuation uses automated and manual methods [50]. | Detailed fold descriptions. "Family" level requires >30% seq. identity or clear functional similarity [50]. |
| CATH | CATH 4.3 (used in Merizo training) [52]. Over 100,000 PDB structures classified [48]. | Hybrid. Class largely automated; Architecture manually assigned; Topology/Homology via structure comparison algorithms (SSAP, CATHEDRAL) [48] [51]. | RCSB PDB browse functionality [51]. Used to train domain segmentation tools like Merizo [52]. Functional annotations via Gene Ontology (GO) [48]. |
A critical challenge is domain segmentation—defining the boundaries of a domain within a multi-domain protein. Disagreements exist; for example, protein kinase CK2 is a two-domain protein in CATH but a single domain in ECOD, as ECOD preserves the active site formed between lobes [52]. Emerging deep learning tools like Merizo, trained on CATH annotations, automate segmentation for both experimental and AlphaFold2-predicted structures, enabling high-throughput analysis [52].
Integration with AOP Development and Taxonomic Domain Analysis
The AOP Wiki serves as the central repository for AOP knowledge [21]. A major challenge in AOP development is defining the taxonomic domain of applicability (tDOA)—the range of species for which the AOP is considered valid [23]. Structural domain databases provide a powerful, evidence-based line of reasoning for extending tDOA beyond the species with empirical data.
Informing Key Events and Taxonomic Applicability
The molecular entities involved in an AOP's Key Events (KEs), especially the MIE, are often proteins. Identifying the specific domain responsible for a chemical interaction allows researchers to query its conservation across species via structural databases.
Case Study (AOP 89): For an AOP linking nicotinic acetylcholine receptor (nAChR) activation to colony death in honey bees (Apis mellifera), defining tDOA for other bees is crucial. Researchers can use the nAChR protein domain classification in ECOD/SCOP/CATH as a query to bioinformatically assess its structural conservation in other insect species [23]. This provides evidence for biological plausibility, a core component of AOP weight-of-evidence assessment [21].
SeqAPASS Workflow: The Sequence Alignment to Predict Across Species Susceptibility (SeqAPASS) tool directly leverages this principle. It operates on three levels:
- Level 1: Compares primary sequence similarity of a target protein to identify orthologs.
- Level 2: Evaluates conservation of specific functional domains (annotated via Pfam, which is linked to structural classifications).
- Level 3: Assesses conservation of individual amino acid residues critical for binding or function (informed by 3D structural data) [23].
Structural databases are foundational for Levels 2 and 3, enabling predictions about whether a chemical stressor could interact with a homologous protein in a different species.
Mapping AOP Coverage and Identifying Gaps
A comprehensive analysis of the AOP-Wiki reveals thematic concentrations and gaps. Current AOPs are heavily focused on diseases of the genitourinary system, neoplasms, and developmental anomalies [27]. This mapping highlights biological areas where structural database-guided target identification could be most impactful for developing new AOPs, such as in underrepresented areas like immunotoxicity or neurotoxicity [27]. The integration of DrugDomain 2.0, which maps ECOD domains to over 37,000 PDB ligands and 7,560 DrugBank molecules, creates a direct bridge from protein domain classification to bioactive chemical space, invaluable for hypothesizing and validating MIEs [26].
Diagram Title: Workflow for Integrating Structural Domain Analysis into AOP Development
Experimental Protocols for Target Identification
This section outlines practical methodologies that leverage structural domain databases for identifying and validating protein targets, a process core to defining MIEs in AOPs.
In Silico Protocol: Structural Bioinformatic Analysis for Cross-Species Extrapolation
Objective: To predict the taxonomic domain of applicability (tDOA) for an MIE involving a protein-ligand interaction, using the nAChR insecticide case as a model [23].
- Identify Reference Protein & Domain: Select the well-characterized target protein (e.g., Apis mellifera nAChR subunit). Determine its constituent structural domain(s) by querying its PDB structure against ECOD, SCOP, or CATH.
- Extract Domain Classification Code: Note the hierarchical classification code (e.g., CATH ID, SCOP sunid, or ECOD H-group identifier).
- Execute SeqAPASS Analysis:
- Level 1: Input the reference protein sequence. Identify orthologs across a broad taxonomic range.
- Level 2: Input the specific Pfam identifier associated with the structural domain. Assess conservation of the domain's presence and sequence.
- Level 3: Input the 3D coordinates of the ligand-binding site residues (from PDB). Evaluate the conservation of these critical residues in orthologs [23].
- Interpret for tDOA: A positive prediction at all three SeqAPASS levels provides strong evidence for structural conservation, supporting the hypothesis that the MIE (nAChR activation) is biologically plausible in those taxa. This computational evidence can be documented in the AOP-Wiki as part of the tDOA justification.
In Vitro/In Chemico Protocol: Affinity Purification Guided by Domain Knowledge
Objective: To experimentally identify the protein target(s) of a natural product or synthetic chemical (stressor) using affinity purification, informed by structural domain predictions [53].
- Design Chemical Probe: Derivative the compound of interest with a functional handle (biotin, alkyne/azide for "click chemistry," or photoaffinity label) without disrupting its bioactivity.
- Prepare Biological Matrix: Incubate the probe with cell lysates, live cells, or tissue homogenates.
- Affinity Capture: Isolate probe-bound protein complexes using streptavidin beads (for biotin) or via click chemistry conjugation to a solid support.
- Mass Spectrometry (MS) Identification: Digest captured proteins, analyze by LC-MS/MS, and identify proteins via database searching.
- Target Prioritization & Validation:
- Filter candidate list by proteins containing structural domains known or predicted to bind similar chemotypes (query DrugDomain using ECOD class [26]).
- Validate direct binding using Cellular Thermal Shift Assay (CETSA) or Surface Plasmon Resonance (SPR).
- For the confirmed target, determine its specific bound domain via structural alignment with known domain-ligand complexes in the PDB.
Diagram Title: SeqAPASS Three-Level Methodology for Taxonomic Extrapolation
Table 3: Research Reagent Solutions and Computational Tools for Domain-Driven Target ID.
| Tool/Resource Name | Type | Primary Function in Target ID | Key Database Integration |
|---|---|---|---|
| DrugDomain 2.0 [26] | Composite Database | Maps known ligands/drugs to ECOD protein domains, enabling MIE hypothesis generation based on domain-chemotype relationships. | ECOD, PDB, DrugBank, AlphaFold DB. |
| SeqAPASS [23] | Bioinformatics Tool | Predicts structural and functional conservation of protein targets across species to define AOP taxonomic applicability (tDOA). | Leverages domain annotations from Pfam/structural DBs. |
| Merizo [52] | Deep Learning Algorithm | Performs automated domain segmentation on experimental or AlphaFold2 protein structures, enabling high-throughput domain assignment. | Trained on CATH domain annotations. |
| Affinity Purification Probes | Chemical Biology Reagent | Biotinylated or clickable probes for "pulling down" protein targets from complex biological mixtures for identification by MS [53]. | Target lists are prioritized using structural domain databases. |
| Photoaffinity Labeling (PAL) Probes | Chemical Biology Reagent | Contain photoreactive groups that form covalent bonds with proximal target proteins upon UV irradiation, capturing transient interactions [53]. | Identified targets are analyzed for conserved binding domains. |
| Cellular Thermal Shift Assay (CETSA) | Biophysical Assay | Validates direct target engagement by measuring ligand-induced thermal stabilization of the candidate protein in cells or lysates. | Confirms binding to protein of a specific domain family. |
The convergence of structural bioinformatics and AOP-driven research is accelerating. Future directions include:
- Routine Integration of AlphaFold: The incorporation of high-confidence AlphaFold2 models into structural databases like ECOD and resources like DrugDomain dramatically expands the structural coverage of the proteome, including human drug targets lacking experimental structures [26] [52]. This will be pivotal for developing AOPs for novel chemicals.
- AI-Enhanced Domain and Function Prediction: Tools like Merizo demonstrate the power of AI to solve fundamental problems like domain segmentation [52]. Next-generation AI will likely predict domain-function and domain-ligand relationships directly from sequence and structural embeddings.
- Quantitative AOPs: Structural databases provide the framework for quantitative structure-activity relationship (QSAR) models at the domain level. Understanding the precise stereochemistry of an MIE allows for predicting the potency of structural analogs, moving AOPs from qualitative to quantitative frameworks.
In conclusion, ECOD, SCOP, and CATH are not merely archival databases but dynamic, interconnected platforms essential for a mechanistic understanding of toxicology and pharmacology. Their strategic application enables the precise identification of molecular targets, rational extrapolation of chemical effects across species, and the systematic development of biologically plausible AOPs. As these resources continue to integrate experimental and AI-predicted structures, ligand annotations, and functional data, they will become even more central to predictive toxicology and next-generation, target-informed drug discovery.
The Adverse Outcome Pathway (AOP) framework provides a structured model for organizing biological knowledge, describing a sequential chain of causally linked events from a Molecular Initiating Event (MIE) to an Adverse Outcome (AO) of regulatory relevance [21]. A critical challenge in AOP development and application is defining the Taxonomic Domain of Applicability (tDOA)—the range of species for which an AOP is biologically plausible [23]. This requires evidence of structural and functional conservation of the key proteins and molecular interactions involved in the pathway.
This case study explores the integration of the DrugDomain 2.0 database—a comprehensive resource for protein domain-drug interactions [54]—into AOP-based research on taxonomic domains. By mapping drug interactions to specific, evolutionarily conserved protein domains, researchers can systematically evaluate the potential for a molecular initiating event (e.g., drug binding) to be conserved across species. This provides a powerful, structure-based line of evidence for hypothesizing and validating the tDOA of AOPs, moving beyond reliance on empirical data from only a handful of test species [23].
DrugDomain 2.0 is a publicly accessible database designed to bridge the gap between evolutionary protein classification and structural pharmacology. Its primary innovation is the systematic mapping of ligand-binding events to specific protein domains as defined by the Evolutionary Classification of Protein Domains (ECOD) hierarchy [54].
Table 1: Core Data Statistics of DrugDomain 2.0 [54]
| Data Category | Count/Description |
|---|---|
| Protein Structures Processed | 174,545 PDB structures |
| Unique UniProt Accessions | 43,023 |
| Cataloged Ligands | Over 37,000 PDB ligands |
| DrugBank Molecules Mapped | 7,560 |
| Small-Molecule PTMs Integrated | >6,000 post-translational modifications |
| Extended Human Protein Models | >14,000 PTM-modified models with docked ligands |
| Key Classification System | Evolutionary Classification of Protein Domains (ECOD) |
| Access | https://drugdomain.cs.ucf.edu/ |
The database links known drugs and small molecules from DrugBank and the PDB to the specific ECOD domains they interact with. Furthermore, it leverages AI-driven predictions from AlphaFold to annotate domain-ligand interactions for human drug targets that lack experimental structures, significantly expanding its coverage [54]. This domain-centric view is critical for tDOA analysis because protein domains are fundamental, conserved units of evolution and function.
Methodological Integration: From Drug Domains to Taxonomic Domains
Experimental and Computational Protocols
Integrating DrugDomain data into AOP tDOA research involves a multi-step workflow that combines database mining, bioinformatic analysis, and evidence synthesis.
Protocol 1: Identifying the Molecular Initiating Event (MIE) and its Protein Domain
- Define the MIE: From the AOP of interest, identify the precise MIE. In a drug-induced AOP, this is typically the specific interaction between a chemical stressor and a biological macromolecule (e.g., "Inhibition of Cytochrome P450 19A1 (Aromatase)") [21].
- Query DrugDomain: Use the drug or ligand name (or structural identifier) to search the DrugDomain 2.0 database.
- Retrieve Domain-Ligand Data: Extract all records showing interaction between the ligand and specific protein domains. The key output is the identification of the specific ECOD domain(s) responsible for binding the drug.
Protocol 2: Assessing Taxonomic Conservation of the Target Domain using SeqAPASS This protocol follows the established methodology for defining the tDOA of an AOP [23].
- Sequence Identification: Obtain the reference amino acid sequence for the protein domain identified in Protocol 1 from a trusted source (e.g., UniProt).
- Level 1 Analysis (Primary Sequence): Input the reference sequence into the Sequence Alignment to Predict Across Species Susceptibility (SeqAPASS) tool. Level 1 evaluates overall sequence similarity across species to identify potential orthologs [23].
- Level 2 Analysis (Functional Domain): Using SeqAPASS, assess the conservation of the specific drug-binding domain (ECOD classification) across species. This determines if the domain's structural scaffold is present in other taxa [23].
- Level 3 Analysis (Critical Residues): Refine the analysis by evaluating the conservation of the individual amino acid residues known to be critical for ligand binding (data which can be derived from DrugDomain's structural annotations). This is the strongest line of structural evidence for conserved interaction potential [23].
- Synthesize Evidence: Combine the SeqAPASS outputs from all three levels to define a biologically plausible tDOA for the MIE. High conservation at Levels 2 and 3 supports a broad tDOA.
Data Synthesis and Application in the AOP-Wiki
The results from this integrated analysis provide direct evidence for the biological plausibility of Key Event Relationships (KERs) within an AOP across species. According to OECD guidance, this evidence should be documented in the respective sections of the AOP-Wiki [21] [23]. Specifically:
- The identification of the conserved binding domain and critical residues supports the "biological plausibility" of the MIE and its upstream KERs.
- The list of species predicted to possess the conserved target based on SeqAPASS analysis defines the proposed tDOA for the MIE and, by extension, informs the tDOA for the entire AOP.
This approach directly addresses identified gaps in the AOP-Wiki, where many AOPs have narrowly defined tDOAs based only on empirically tested species, lacking computational evidence for broader taxonomic applicability [23] [27].
Table 2: Example Output: Integrating DrugDomain & SeqAPASS Results into an AOP-Wiki Entry
| AOP-Wiki Section | Content to be Enhanced | Integrated Evidence from DrugDomain & SeqAPASS |
|---|---|---|
| Molecular Initiating Event (MIE) | Description of the stressor-target interaction. | Specify the exact ECOD domain (e.g., "H.2.1.1: Cytochrome P450, catalytic domain") responsible for binding. |
| Weight of Evidence for KERs | Assessment of biological plausibility. | State: "The drug-binding domain is evolutionarily conserved across mammals, birds, and fish (SeqAPASS Levels 2 & 3), making this interaction biologically plausible in these taxa." |
| Taxonomic Domain of Applicability | List of known/tested species. | Expand list to include species predicted via bioinformatics (e.g., "Plausible for all vertebrates possessing the conserved [ECOD ID] domain, as predicted by SeqAPASS analysis."). |
| Uncertainties and Inconsistencies | Gaps in knowledge. | Note: "Functional activity of the bound domain in non-tested species requires empirical confirmation." |
Table 3: Research Reagent Solutions for Drug-Domain & AOP-tDOA Research
| Tool/Resource Name | Type | Primary Function in This Context | Key Features / Notes |
|---|---|---|---|
| DrugDomain 2.0 [54] | Database | Maps drugs/ligands to specific evolutionary protein domains (ECOD). | Core resource. Provides structural basis for the MIE. Links to PDB, DrugBank, and AlphaFold models. |
| AOP-Wiki [21] | Knowledgebase | Central repository for developing, sharing, and assessing AOPs. | Platform for documenting the integrated evidence (MIE, KERs, tDOA). Follows OECD Handbook templates. |
| SeqAPASS Tool [23] | Bioinformatics Tool | Evaluates protein sequence and domain conservation across species to predict susceptibility. | Provides the multi-level (sequence, domain, residue) analysis critical for defining tDOA. |
| IID 2025 [55] | Database | Provides comprehensive, experimentally detected protein-protein interaction (PPI) data. | Useful for researching downstream KEs in an AOP that involve PPIs, adding network context. |
| PLM-interact [56] | Prediction Algorithm | Predicts protein-protein interactions from sequence using advanced protein language models. | Can hypothesize downstream KERs involving novel or poorly characterized PPIs, especially for non-model species. |
| AlphaFold DB | Database / Model | Provides high-accuracy predicted protein structures. | Complements DrugDomain by offering structural models for species/targets lacking experimental PDB files. |
The integration of structural drug-domain interaction data from resources like DrugDomain 2.0 with the AOP framework represents a significant advance in predictive toxicology and ecotoxicology. This methodology provides a rigorous, computationally efficient approach to hypothesize and validate the taxonomic domain of applicability for drug-induced AOPs. It shifts the paradigm from a reliance on empirical data alone to a structure-based, predictive model for cross-species extrapolation [23].
Future developments should focus on increased automation, directly linking databases like DrugDomain and SeqAPASS to the AOP-Wiki to allow for real-time tDOA updates as new protein structures and genomes are sequenced. Furthermore, integrating functional activity predictions (e.g., whether a conserved binding domain in a new species retains analogous pharmacodynamics) will be the next critical step to move from structural plausibility to confident functional prediction. This integrated approach is essential for implementing the New Approach Methodologies (NAMs) championed by major research initiatives like the European Partnership for the Assessment of Risks from Chemicals (PARC), enabling more efficient and broader-reaching chemical safety assessments [27].
The systematic organization of complex biological and chemical information represents a critical bottleneck in modern drug development and safety assessment. Taxonomic logic, the practice of classifying entities within a structured hierarchy based on shared characteristics, provides a powerful solution to this challenge. Within the context of regulatory science and toxicology, this logic is operationally embodied in the Adverse Outcome Pathway (AOP) framework. An AOP is a conceptual construct that organizes mechanistic knowledge linking a molecular perturbation by a stressor (e.g., a chemical) to an adverse outcome at the organism or population level [28]. This framework was developed to address the inadequacy of traditional toxicity tests in the face of tens of thousands of untested chemicals in the environment [27].
The formal development and curation of AOPs are centralized in the AOP-Wiki, an interactive, crowd-sourced knowledge base supported by the Organisation for Economic Co-operation and Development (OECD) [27] [28]. The AOP-Wiki and its associated databases, such as the U.S. EPA's AOP Database (AOP-DB), function as living taxonomies for biological pathways. They do not merely list events but structure them into a causal, hierarchical network of Key Events (KEs), from a Molecular Initiating Event (MIE) through intermediate biological changes to an ultimate Adverse Outcome (AO) [27]. This application of taxonomic logic transforms fragmented research data—from high-throughput in vitro assays, omics technologies, and traditional in vivo studies—into a machine-readable, queryable, and reusable knowledge asset [28]. For researchers and drug development professionals, these taxonomies are indispensable for prioritizing chemicals for testing, identifying novel biomarkers of toxicity, and supporting the integration of New Approach Methodologies (NAMs) into regulatory decision-making [27].
Core Principles of Taxonomic Organization in AOP Development
The construction of a scientifically robust and computationally useful AOP taxonomy is governed by a set of core principles that ensure consistency, reliability, and interoperability across the global research community.
- Structured Causal Continuum: The fundamental taxonomic unit in an AOP is the Key Event (KE). KEs are organized into a mandatory causal sequence: MIE → Intermediate KEs → Adverse Outcome. This creates a directed graph where relationships are not merely associative but are supported by evidence of causation [27]. Each KE must be defined at a specific level of biological organization (e.g., molecular, cellular, tissue, organ, organism).
- Ontology-Driven Annotation: To prevent ambiguity and enable computational analysis, every KE is annotated using standardized ontologies and controlled vocabularies. For example, biological processes are tagged with terms from the Gene Ontology (GO), while diseases are linked to identifiers from DisGeNET [27] [31]. This practice aligns with the FAIR principles (Findable, Accessible, Interoperable, Reusable), making the knowledge machine-actionable [27].
- Evidence-Based Weighting and Confidence: The taxonomic relationships within an AOP are not binary; they carry associated weights and confidence levels. Each Key Event Relationship (KER) is evaluated based on the strength of empirical evidence (e.g., dose-response, temporal concordance, biological plausibility). This allows users to gauge the reliability of the proposed pathway and identify areas requiring further research [27].
- Domain of Applicability: A critical taxonomic dimension is defining the biologically plausible domain of applicability. This specifies the taxonomic range (e.g., species, sex, life stage) for which the AOP is considered valid. Evidence for this domain is derived from empirical studies and computational analyses of structural and functional conservation across species [31].
Experimental Protocol: Building and Validating an AOP Taxonomy
The development of an AOP follows a systematic, community-reviewed protocol established by the OECD.
- Knowledge Assembly and Hypothesis Formulation: Researchers collate all existing mechanistic information from the published literature on a specific toxicological outcome. This involves systematic reviews to identify candidate MIEs and intermediate KEs.
- Structured Entry in AOP-Wiki: The hypothetical pathway is formally entered into the AOP-Wiki platform. Each KE is defined, and KERs are articulated. Ontologies are used to annotate all components (e.g., linking "AhR activation" to its corresponding Gene Ontology term and Entrez Gene ID) [31] [28].
- Evidence Linking and Assessment: For every KER, supporting evidence is uploaded and categorized. The OECD handbook guidelines are used to evaluate the weight of evidence across modified Bradford-Hill considerations.
- Computational Mapping and Network Analysis (Gap Identification): Bioinformatics tools are employed to analyze the assembled AOP. As demonstrated by Jaylet et al. (2024), this involves:
- Extracting all gene/protein and disease identifiers from the AOP-Wiki.
- Performing overrepresentation analysis using GO and DisGeNET to classify AOPs into biological and disease spaces [27].
- Constructing AOP networks (AOPN) to visualize interconnectivity and identify central, hub KEs that are common to multiple AOPs [27].
- Peer Review and OECD Endorsement: The draft AOP undergoes a rigorous peer-review process within the AOP-Wiki forum [31]. Once revised and consensus is reached, it can be submitted for formal OECD endorsement, granting it higher status for use in regulatory contexts.
Table 1: Quantitative Analysis of Current AOP Taxonomy Focus Areas (Based on AOP-Wiki Mapping)
| Disease/Biological System Category | Relative Representation in AOP-Wiki | Example Adverse Outcomes | Key Research Initiatives |
|---|---|---|---|
| Genitourinary System Diseases | High | Renal fibrosis, impaired function [27] | PARC Work Package [27] |
| Neoplasms (Non-genotoxic carcinogenesis) | High | Liver tumour promotion, thyroid follicular cell adenoma [27] | EURION & ASPIS Clusters [27] |
| Developmental Anomalies | High | Neural tube defects, skeletal malformations [27] | PARC DNT & Immunotoxicity focus [27] |
| Endocrine & Metabolic Disruption | Moderate | Obesity, fatty liver disease, diabetes [27] | EURION Cluster [27] |
| Developmental & Adult Neurotoxicity | Moderate (identified as a priority gap) | Cognitive deficit, neurodegeneration [27] | PARC, EFSA projects [27] [31] |
AOP Core Taxonomic Structure
Industry Applications: From Taxonomy to Decision-Making
The taxonomic organization of AOPs is not an academic exercise but a practical tool that directly impacts efficiency and innovation in the pharmaceutical and chemical industries.
- Supporting Generic Drug Development: For generic drug applicants, demonstrating therapeutic equivalence to a reference product is paramount. AOP taxonomies, integrated into resources like the U.S. FDA's AOP-DB, help identify critical biological pathways and molecular targets that must be unaffected by formulation changes. This informs the design of bioequivalence studies and can streamline the development of complex generic products, a key topic in ongoing FDA workshops [57] [28].
- Enabling New Approach Methodologies (NAMs): The shift from animal-intensive testing to human-relevant, non-animal methods relies on mechanistic taxonomies. An AOP provides the conceptual bridge that links a molecular response measured in a high-throughput in vitro assay (e.g., receptor activation at the MIE level) to a regulatory-relevant adverse outcome. This is fundamental to Integrated Approaches to Testing and Assessment (IATA) [27].
- Informing Chemical Risk Assessment: For "data-poor" chemicals, AOP taxonomies allow for read-across and prioritization. By querying the AOP-DB with a chemical structure, regulators can identify which MIEs and pathways it may perturb based on structural similarity to "data-rich" chemicals, enabling more efficient targeting of testing resources [28].
- Guiding AI and Computational Modeling: The structured, ontology-rich nature of AOP taxonomies provides the perfect ground-truth framework for training and validating artificial intelligence models in toxicology and drug discovery. Ontologies formalize domain knowledge, making it machine-processable and enhancing the explainability of AI predictions, a principle highlighted in AI-enhanced Failure Mode and Effects Analysis (FMEA) for systems engineering [58].
Table 2: Key Research Reagent Solutions for AOP Taxonomy Development
| Tool/Resource Name | Primary Function | Role in Taxonomic Organization | Source/Access |
|---|---|---|---|
| AOP-Wiki | Crowdsourced knowledge base for AOP development and curation. | The primary platform for entering, structuring, and peer-reviewing the AOP taxonomy itself. | OECD [27] [31] |
| AOP Database (AOP-DB) | Integrative database linking AOPs to genes, chemicals, diseases, and pathways. | Enables complex queries across the taxonomy (e.g., "Which AOPs involve this gene?"), turning taxonomy into a searchable asset. | U.S. EPA [28] |
| Gene Ontology (GO) & DisGeNET | Standardized ontologies for biological processes and human diseases. | Provides the controlled vocabulary for annotating Key Events, ensuring semantic consistency and enabling computational analysis. | Gene Ontology Consortium, DisGeNET [27] |
| AOP-helpFinder | Text-mining tool to scan literature for potential AOP-related evidence. | Automates the discovery of evidence to populate and support taxonomic relationships (KERs) within an AOP. | Research tool [27] |
| SeqAPASS | Computational tool for comparing protein sequence similarity across species. | Informs the domain of applicability taxonomy by assessing the biological plausibility of an AOP across different species. | U.S. EPA [31] |
Regulatory Impact and Future Directions
The adoption of taxonomic frameworks like AOPs is reshaping regulatory science. The European Medicines Agency (EMA) and the U.S. FDA are increasingly referencing mechanistic data in guidance documents. The Partnership for the Assessment of Risks from Chemicals (PARC), a major EU initiative, has the development and use of AOPs as a central pillar of its strategy to advance next-generation risk assessment [27]. However, the regulatory landscape is dynamic. In 2025, both the FDA and EMA have seen fluctuations in approval rates, with noted challenges including staffing changes and shifts in policy affecting the approval environment for both new drugs and complex generics [59] [60]. In this context, well-organized, evidence-based taxonomic assets provide a stable scientific foundation for regulatory submissions and decisions.
Future advancements in the field will focus on enhancing the machine-actionability and intelligence of these taxonomies. This includes the development of more sophisticated ontology-driven annotation tools [61], the integration of AOP networks with AI for predictive toxicology [58], and the continued expansion of the AOP knowledge base into underrepresented areas like developmental neurotoxicity and immunotoxicity [27]. The ongoing community discussions in forums like the AOP Forum highlight active work on standardizing KE names, improving ontology mappings, and developing better visualization tools for AOP networks—all essential for the evolution of this critical taxonomic infrastructure [31].
Taxonomic Logic Workflow from Data to Application
Resolving Ambiguity: Common Challenges in Domain Classification and Interpretation
The classification of cellular life into either a Three-Domain (Bacteria, Archaea, Eukarya) or a Two-Domain (Bacteria, Archaea-including-Eukarya) system is a foundational debate in evolutionary biology with profound implications for applied research [62] [10]. The Three-Domain System, established by Carl Woese based on 16S ribosomal RNA phylogeny, posits Archaea and Eukarya as distinct sister groups that diverged from a common ancestor [62]. In contrast, the emerging Two-Domain System, revitalized by the discovery of "eukaryote-like" Asgard archaea, argues that Eukarya emerged from within the Archaea, rendering the latter paraphyletic [10]. This revision is not merely academic; it directly influences the Taxonomic Domain of Applicability (tDOA) for biological pathways, a core concept in the Adverse Outcome Pathway (AOP) framework [23]. Accurately defining the tDOA—the taxonomic range across which a Key Event Relationship (KER) is biologically plausible—is critical for reliable extrapolation in toxicology and drug development [21] [23]. Consequently, this debate necessitates rigorous methodologies to evaluate and integrate new phylogenetic evidence into structured knowledge systems like the AOP-Wiki.
Core Evidence and Arguments in the Taxonomic Debate
The debate centers on conflicting lines of molecular evidence and differing interpretations of eukaryotic origins. The following table summarizes the core arguments for each system.
Table 1: Core Arguments for the Two-Domain and Three-Domain Systems of Classification
| Aspect | Two-Domain System (Eukaryotes within Archaea) | Three-Domain System (Bacteria, Archaea, Eukarya) |
|---|---|---|
| Phylogenetic Signal | Phylogenomics of conserved proteins, especially ribosomal proteins, often place Eukarya as a branch within Archaea, specifically as sister to the TACKL or Asgard superphyla [63] [10]. | Phylogenies based on Small-Subunit (SSU) rRNA and some concatenated gene sets consistently recover three monophyletic, distinct domains [63] [62]. |
| Eukaryotic Signature Proteins (ESPs) | Genes encoding homologs of actin, tubulin, ESCRT, and parts of the ubiquitin system are found in TACK and Asgard archaeal genomes, suggesting a deep archaeal root for eukaryotic cellular machinery [10]. | Eukaryotic proteomes contain a vast number of unique Protein Domain Fold Superfamilies (FSFs) not found in akaryotes. The distribution of shared FSFs shows greater eukaryotic similarity to Bacteria than to Archaea, challenging a direct archaeal ancestry [63]. |
| Evolutionary Scenario | Supports the eocyte hypothesis: eukaryotes originated from an archaeal host (likely an Asgard archaeon) that engulfed an alphaproteobacterial endosymbiont [10]. | Supports a sister-group relationship between Archaea and Eukarya, with eukaryogenesis involving a symbiotic merger between distinct archaeal and bacterial lineages [63] [62]. |
| Technical Critiques | Argues that SSU rRNA trees are prone to Long-Branch Attraction artifacts and that the three-domain topology can be a methodical artifact of poor outgroup choice or heterogeneous sequence evolution [63]. | Argues that phylogenies supporting the two-domain view can be misled by compositional bias, horizontal gene transfer, and the challenges of modeling deep evolutionary time in concatenated supermatrices [63]. |
A quantitative analysis of protein domain structures highlights a significant challenge for the Two-Domain view. An examination of 1,661 Fold Superfamilies (FSFs) in eukaryotic proteomes revealed a striking imbalance in shared ancestry: Eukarya share 283 FSFs exclusively with Bacteria (BE group), but only 34 exclusively with Archaea (AE group) [63]. This 8:1 ratio contradicts the expectation of greater shared molecular heritage between Eukarya and their putative archaeal ancestors.
Implications for AOP Development and the Taxonomic Domain of Applicability (tDOA)
The AOP framework organizes mechanistic knowledge from a Molecular Initiating Event (MIE) to an Adverse Outcome (AO) through measurable Key Events (KEs) [21]. A fundamental principle is that KEs and their relationships (KERs) are modular and should be described independently of specific taxa to enable broad utility [21]. Defining the tDOA—the taxonomic range across which a KER is considered biologically plausible—is therefore critical for reliable application in ecological risk assessment or translational biology [23].
The Two- vs. Three-Domain debate directly impacts tDOA at the deepest phylogenetic level. For example, an MIE involving a conserved prokaryotic protein found in both Bacteria and Archaea would have a very broad tDOA under the Three-Domain system. Under a Two-Domain system, the same MIE’s tDOA would inherently include Eukarya if the protein is also part of the inherited archaeal core. Resolving this is essential for confident extrapolation. AOP development handbooks emphasize that the suitability of an AOP for regulatory use depends on the weight of evidence for KERs, which includes biological plausibility across species [21]. Thus, modern AOP development must incorporate rigorous, evidence-based tDOA definitions that can accommodate ongoing taxonomic revision.
Methodologies for Evaluating Taxonomic Conservation in AOPs
Bioinformatics Workflow for Defining tDOA: The SeqAPASS Tool
A systematic approach to defining tDOA leverages bioinformatics to evaluate structural conservation. The Sequence Alignment to Predict Across Species Susceptibility (SeqAPASS) tool is a publicly available web-based platform designed for this purpose [23].
Table 2: SeqAPASS Analysis Levels for Evaluating Taxonomic Domain of Applicability [23]
| Level | Analysis Focus | Purpose | Key Output |
|---|---|---|---|
| Level 1 | Primary amino acid sequence similarity. | Identifies putative orthologs across species by assessing overall sequence conservation. | List of species possessing a protein with significant sequence homology to the query. |
| Level 2 | Conservation of specific functional domains and motifs. | Determines if identified orthologs retain the critical functional units (e.g., ligand-binding domains, catalytic sites). | Evidence of domain architecture conservation across taxa. |
| Level 3 | Conservation of individual critical amino acid residues. | Evaluates preservation of specific residues known to be essential for protein-ligand interaction, protein-protein interaction, or catalytic function. | High-resolution evidence for functional conservation, narrowing the plausible tDOA. |
Experimental Protocol for SeqAPASS Analysis:
- Identify Query Protein(s): For a given KE (e.g., binding to a specific receptor), identify the primary protein(s) mediating the event. In the case study for AOP 89 (nicotinic acetylcholine receptor activation), nine proteins were identified [23].
- Acquire Reference Sequences: Obtain the full-length amino acid sequences for the query proteins from a trusted source organism (e.g., Apis mellifera for a honey bee AOP).
- Execute Level 1 Analysis: Input the query sequence into SeqAPASS. The tool performs alignments against a comprehensive protein database, returning a taxonomic list and similarity scores. A preliminary tDOA is inferred based on the presence of orthologs.
- Execute Level 2 Analysis: Using the same query, specify the known functional domains (e.g., Pfam domains). SeqAPASS evaluates the conservation of these domains in the orthologs identified in Level 1.
- Execute Level 3 Analysis: Input the positions of known critical residues (from site-directed mutagenesis studies or crystallography data). SeqAPASS assesses whether these specific residues are conserved in orthologs from species of interest.
- Synthesize Evidence: Integrate results from all three levels. A species is included in the biologically plausible tDOA if it shows conservation at Level 1 and retains critical features at Levels 2 and 3. This computationally-derived tDOA can be combined with empirical toxicity data to form a robust, evidence-based tDOA for the AOP [23].
Phylogenomic and Phylogenetic Methods for Deep Taxonomic Revision
Addressing the domain-level debate requires different, large-scale evolutionary methods.
Experimental Protocol for Phylogenomic Analysis Supporting Domain Revisions:
- Dataset Assembly: Compile a phylogenomic dataset of conserved, vertically inherited genes (e.g., ribosomal proteins, DNA replication machinery). Studies supporting the Two-Domain system have used sets of 36-53 core genes [63] [10].
- Taxon Sampling: Include a broad, representative sample from Bacterial phyla, Archaeal superphyla (including TACK, Asgard, Euryarchaeota), and diverse Eukaryotic lineages.
- Sequence Alignment and Curation: Align amino acid sequences using tools like MAFFT or Clustal Omega. Manually curate alignments to remove poorly aligned regions.
- Model Selection and Tree Inference: Use model testing software (e.g., ProtTest) to find the best-fit model of sequence evolution. Perform phylogenetic inference using Maximum Likelihood (e.g., RAxML, IQ-TREE) or Bayesian methods (e.g., MrBayes, PhyloBayes). Critical step: Apply models that account for site-heterogeneity and compositional bias (e.g., CAT-GTR) [63].
- Testing Alternative Topologies: Use statistical tests (Approximately Unbiased test, SH-test) to rigorously compare the fit of the Two-Domain (eukaryotes-within-archaea) topology against the Three-Domain topology.
- Analysis of Complementary Data: Independently analyze protein domain structure data (FSF distribution) [63] and gene content to check for congruence with sequence-based trees.
Visualization of Taxonomic Relationships and Changes
Effective visualization is key to communicating complex taxonomic revisions and their implications. For hierarchy comparison—such as contrasting the Two- and Three-Domain trees—research with taxonomy experts has shown that the Edge Drawing method is preferred for identifying congruence and changes (splits, merges, moves) [64]. This method clearly links corresponding nodes (taxa) between two side-by-side trees.
Table 3: Visualization Methods for Taxonomic Comparison and Data Representation [64] [65]
| Method | Best Use-Case | Relevance to Domain Debate & AOPs | Color Application Rule [65] |
|---|---|---|---|
| Edge Drawing | Comparing two hierarchical structures (e.g., old vs. new taxonomy). | Ideal for visually demonstrating the fundamental reorganization from a 3- to a 2-Domain system. | Use high-contrast colors (e.g., #EA4335) for edges connecting moved taxa. |
| Matrix Representation | Summarizing relationships and changes across many taxa. | Could summarize the distribution of ESPs or FSFs across domains. | Use a sequential color palette (e.g., light to dark #34A853) for continuous data like similarity scores. |
| Coloring/Highlighting | Emphasizing specific groups or changes within a single structure. | Highlighting Asgard archaea within Archaea, or illustrating tDOA breadth on a tree. | For categorical data (e.g., Domains), use a qualitative palette (#4285F4, #FBBC05, #EA4335). Ensure accessibility. |
| Animation | Showing the process of change between two states. | Useful for interactive explanations of eukaryogenesis scenarios. | Ensure color consistency and contrast are maintained throughout the transition. |
When applying color to biological visualizations, it is crucial to follow established rules: 1) Identify the nature of your data (categorical/nominal for domains), 2) Select an appropriate color space (like perceptually uniform CIE Lab*), and 3) Check for color deficiencies to ensure accessibility [65]. The diagrams below adhere to a specified accessible color palette.
Table 4: Research Reagent Solutions for Taxonomic and AOP Integration Studies
| Tool / Resource | Primary Function | Application in Domain Debate & AOP tDOA |
|---|---|---|
| SeqAPASS Tool [23] | A bioinformatics tool for cross-species protein sequence and structural comparison across three levels. | The primary method for empirically defining and expanding the biologically plausible tDOA for an AOP's KEs based on structural conservation. |
| AOP-Wiki (aopwiki.org) [21] | The central repository for developing, sharing, and assessing Adverse Outcome Pathways. | The platform where tDOA for KEs and KERs should be documented and updated in light of new taxonomic evidence. |
| NCBI Taxonomy & Protein Databases | Authoritative taxonomic classification and comprehensive repositories of protein sequences. | Sources for reference sequences (for SeqAPASS queries) and for validating the taxonomic identity of organisms in phylogenetic analyses. |
| Phylogenetic Software (e.g., IQ-TREE, PhyloBayes) | Software for inferring evolutionary trees from molecular sequence data using advanced statistical models. | Essential for generating and testing phylogenetic hypotheses that underpin domain-level classifications (e.g., CAT-GTR model to reduce artifact) [63]. |
| Structural Classification of Proteins (SCOP) Database | A database that classifies protein domains by structural and evolutionary relationships. | Used for analyzing the distribution of Fold Superfamilies (FSFs) across domains of life, providing an independent line of structural evidence [63]. |
| Hierarchy Comparison Visualization Software [64] | Specialized tools (implementing Edge Drawing, Matrix, etc.) for comparing taxonomic trees. | To visually reconcile different taxonomic classifications and communicate changes effectively to AOP developers and users. |
The Two-Domain vs. Three-Domain debate is a dynamic example of how foundational biological classification evolves with new evidence. For AOP developers and users in applied toxicology and pharmacology, this underscores a critical imperative: the Taxonomic Domain of Applicability is a hypothesis, not a permanent assertion. It must be actively defined and revised using the best available phylogenetic and bioinformatic evidence.
Practical Guidance for Researchers:
- Document tDOA Explicitly: When developing or using an AOP, move beyond listing species. Use the AOP-Wiki to document the evidence for tDOA, citing phylogenetic analyses or SeqAPASS results [23].
- Adopt a Modular, Evidence-Based Approach: Treat KEs and KERs as independent modules. Their tDOA should be defined by the conservation of the underlying biology (e.g., protein targets, pathways), not by the taxon of the initial study [21].
- Integrate Bioinformatics: Incorporate tools like SeqAPASS as a standard step in AOP development to provide scalable, evidence-based lines of reasoning for tDOA.
- Stay Current with Taxonomic Revisions: Subscribe to updates from genomic databases and phylogenetic literature. Major revisions, like the potential formal adoption of a Two-Domain system, would necessitate a review of tDOAs for many AOPs, particularly those with MIEs in deeply conserved pathways.
By embracing these practices, the AOP community can ensure its knowledge base remains robust, transparent, and adaptable—turning the challenge of taxonomic revision into an opportunity for increased scientific rigor and predictive confidence.
The classification of non-cellular life forms—primarily viruses and prions—presents a fundamental challenge to biological taxonomy and modern mechanistic frameworks like the Adverse Outcome Pathway (AOP). These entities defy the central tenets of the classical cellular definition of life: they lack independent metabolism, cannot self-replicate without a host, and possess a structural and genetic simplicity that blurs the line between organism and biological molecule [66]. Prions, defined as proteinaceous infectious particles, further challenge the nucleic-acid-centric dogma of information transfer and inheritance [67] [68]. This technical guide examines the core scientific challenges in classifying these entities, including taxonomic ambiguity, extreme genome reduction, and structural diversity. It frames these challenges within the AOP framework, which provides a structured, modular approach for linking molecular perturbations to adverse outcomes, offering a potential pathway to a more functional and mechanistic classification system applicable for toxicology and drug development [21] [23]. The integration of bioinformatic tools and a detailed understanding of molecular initiating events (MIEs) is critical for defining the taxonomic domain of applicability (tDOA) for biological pathways involving these non-cellular agents [23] [27].
Defining the Non-Cellular Landscape
Non-cellular entities exist on a spectrum of complexity, from intricate, gene-rich giant viruses to the minimalistic prion protein. Traditional taxonomy, built upon cellular organization and phylogenetic relationships, struggles to accommodate them.
- Viruses: Acellular, obligate intracellular parasites consisting of genetic material (DNA or RNA) enclosed within a protein capsid, sometimes with a lipid envelope [66]. They lack ribosomes and metabolic machinery, hijacking host cell processes for replication. Their origins remain enigmatic, with hypotheses suggesting they may be remnants of cellular life (reduction), escaped genetic elements (escape), or ancient precursors to life (virus-first) [66].
- Prions: Infectious pathogens composed solely of misfolded protein (PrPSc). They propagate by inducing the conformational change of the host's normal cellular prion protein (PrPC) into the pathological isoform, without encoding any genetic information [67] [68]. This protein-only hypothesis, validated for transmissible spongiform encephalopathies (TSEs) like Creutzfeldt-Jakob disease and scrapie, represents a radical departure from all other known infectious agents [69] [68].
- Boundary Cases: Discoveries like Sukunaarchaeum mirabile intensify classification debates. This archaeon possesses an extremely reduced genome (238,000 base pairs) lacking metabolic pathways but retains genes for core replication machinery (DNA replication, transcription, translation). This suggests an unprecedented level of host dependence that challenges the functional distinction between minimal cellular life and viruses [70].
Table 1: Comparative Overview of Acellular Entities and Boundary Cases
| Feature | Virus (e.g., Herpesvirus) | Prion (PrPSc) | Boundary Case (Sukunaarchaeum mirabile) |
|---|---|---|---|
| Genetic Material | DNA or RNA (single/double-stranded) | None | DNA (extremely reduced genome) |
| Core Replication Machinery | Absent; utilizes host | Absent; template-directed misfolding | Present (genes for replication, transcription, translation) |
| Metabolic Pathways | Absent | Absent | Profoundly stripped-down |
| Structural Complexity | Capsid ± envelope | Misfolded protein aggregate | Cellular (Archaeal) |
| Primary Mode of Replication | Hijacks host cell biosynthesis | Conformational conversion of host PrPC | Unknown; presumed high host dependence |
| Key Challenge to Taxonomy | Lack of universal genetic marker, polyphyletic origins | Absence of nucleic acid, conformation-encoded "strain" properties | Blurs line between independent organism and dependent replicon |
Core Classification Challenges
Taxonomic Ambiguity and the "Life" Debate
The central debate hinges on whether viruses and prions are "alive." Life is typically defined by characteristics like growth, metabolism, homeostasis, and independent reproduction. Viruses and prions only exhibit activity—replication, evolution—within a permissive host cell [66]. The International Committee on Taxonomy of Viruses (ICTV) classifies viruses based on genomic and structural properties, but this system operates parallel to the taxonomy of cellular life. Prions are not classified within a biological domain at all but are often categorized by the disease they cause (e.g., scrapie prion, BSE prion) [68]. This ambiguity complicates systematic biological research and database organization.
Genome Reduction and Host Dependence
The discovery of entities with severely minimized genomes highlights a continuum of host dependence. Sukunaarchaeum mirabile’s genome is less than half the size of the next smallest known archaeal genome [70]. Similarly, viruses exhibit a wide range of genome sizes, with some giant viruses rivaling bacteria in genetic content, while others are minimal. This extreme reduction forces a re-evaluation of the minimum genetic requirements for a "living" entity and questions whether heavy reliance on host machinery is a quantitative or qualitative difference from viral parasitism.
Structural and "Strain" Diversity Without Nucleic Acid Templates
A major objection to the prion hypothesis was the existence of distinct prion "strains" that cause different disease phenotypes. It was traditionally believed such complexity required genetic encoding [69]. It is now established that prion strain diversity is enciphered in the three-dimensional conformation of the PrPSc aggregate [69]. Different conformations templates lead to distinct pathological profiles, neurotropism, and incubation periods. This demonstrates that biological information and heritable variation can exist independently of nucleic acid sequences, a concept with profound implications for understanding other protein-misfolding diseases like Alzheimer's and Parkinson's [69].
Functional Overlap: Prion-Like Domains in Viruses
Bioinformatic analyses reveal that the functional properties of prions are not exclusive to TSEs. A systematic screen of eukaryotic viral proteomes identified 2,679 putative prion-like domains (PrDs) in 735 different viruses [71]. These domains, enriched in asparagine and glutamine, are statistically similar to known yeast prion domains. They are more prevalent in DNA viruses and enveloped viruses, and are found in significant proportions in orders like Herpesvirales (71.84% of species) and Nidovirales (93.75% of species) [71]. These viral PrDs are functionally associated with critical steps in the viral life cycle, including capsid assembly, host-cell attachment, and nucleic acid binding, suggesting they may regulate viral infectivity and host interactions [71].
Table 2: Prevalence of Prion-like Domains (PrDs) Across Selected Viral Taxa [71]
| Viral Order | Example Families | Key Hosts | Percentage of Species with ≥1 PrD | Functional Associations of Identified PrDs |
|---|---|---|---|---|
| Herpesvirales | Herpesviridae | Humans, animals | 71.84% | Capsid assembly, tegument formation, host immune modulation |
| Nidovirales | Coronaviridae, Arteriviridae | Mammals, birds | 93.75% | RNA replication/transcription, spike protein function |
| Mononegavirales | Paramyxoviridae, Rhabdoviridae | Humans, animals, plants | ~40% | Nucleocapsid formation, polymerase function, matrix protein assembly |
| Picornavirales | Picornaviridae | Humans, animals | ~25% | Virion structure, RNA replication |
The AOP Framework: A Mechanistic Lens for Classification
The Adverse Outcome Pathway framework, developed for toxicological research, offers a structured way to describe the mechanistic sequence of events from a molecular perturbation to an adverse outcome. This modular approach is uniquely suited to describing the pathogenesis of non-cellular entities.
- Molecular Initiating Event (MIE): For a virus, the MIE is the specific binding of a viral surface protein to a host cell receptor. For a prion, it is the interaction between pathogenic PrPSc and host PrPC [21].
- Key Events (KEs): These are measurable, essential biological steps. In a viral AOP, KEs would include viral entry, genome replication, and host cell lysis. In a prion AOP, KEs include PrPSc-driven conversion of PrPC, aggregation, neuronal dysfunction, and spongiform degeneration [67] [21].
- Key Event Relationships (KERs): These describe the causal linkage between KEs. A KER establishes, for example, that neuronal apoptosis (a downstream KE) is a consequence of widespread protein aggregation (an upstream KE) [21].
- Adverse Outcome (AO): The disease state relevant to risk assessment, such as clinical Creutzfeldt-Jakob disease or influenza-related mortality [21] [68].
Defining the Taxonomic Domain of Applicability (tDOA)
A critical aspect of AOP use is defining the tDOA—the range of species in which the pathway is biologically plausible [23]. For non-cellular entities, this hinges on the conservation of the MIE. Tools like the Sequence Alignment to Predict Across Species Susceptibility (SeqAPASS) use bioinformatics to assess the structural conservation of target proteins (e.g., the host prion protein PRNP or a viral receptor) across species [23]. This provides evidence-based boundaries for which species are potentially susceptible to a given virus or prion strain, moving beyond anecdotal or assumption-based classifications.
AOP Networks and Shared Biology
Many viruses and prions share downstream KEs, such as triggering innate immune responses or apoptosis. In the AOP-Wiki, these shared KEs become nodes that can link different AOPs into networks [21] [27]. For instance, an AOP for viral-induced neuroinflammation and an AOP for prion-induced neuroinflammation would converge on common KEs related to glial cell activation. This network view emphasizes functional biology over agent-centric classification, revealing shared pathogenic mechanisms across different classes of non-cellular entities.
Prion Disease AOP: MIE to AO
Detailed Experimental Protocols for Characterization
Objective: To scan viral proteomes for regions with compositional similarity to known prion-forming domains. Method:
- Sequence Acquisition: Retrieve all eukaryotic viral protein sequences from the UniProt Knowledgebase (Swiss-Prot/TrEMBL). Remove redundant sequences.
- Algorithm Selection: Utilize the PLAAC (Prion-Like Amino Acid Composition) algorithm. PLAAC uses a hidden Markov model (HMM) trained on yeast prion domains, scanning for regions enriched in asparagine (N) and glutamine (Q), with specific hydrophobicity and charge profiles.
- Parameter Setting: Set the alpha parameter to 0.0 for a species-independent background frequency scan. Apply a permissive log-likelihood ratio (LLR) cutoff (e.g., 0.003) for initial broad identification.
- Validation: Run top candidate sequences through orthogonal prediction algorithms (e.g., PAPA, PrionW) that use different statistical models or consider intrinsic disorder propensity.
- Functional Annotation: Map identified PrDs to viral protein functions using Gene Ontology (GO) terms and manual curation based on literature and database entries (e.g., NCBI, UniProt).
- Statistical & Taxonomic Analysis: Compare prevalence of PrDs across viral orders/families using χ² or Fisher's exact tests. Generate heatmaps to visualize LLR score distributions.
Objective: To computationally assess the structural conservation of a viral or prion host target protein across species to infer potential susceptibility. Method:
- Query Protein Selection: Identify the primary protein mediating the MIE (e.g., host cellular prion protein PRNP for prion diseases; host receptor like ACE2 for SARS-CoV-2).
- SeqAPASS Level 1 Analysis (Primary Sequence):
- Input the full-length amino acid sequence of the query protein.
- The tool performs BLASTP against the NCBI protein database, identifying orthologs based on sequence similarity and phylogenetic relationships.
- Output is a list of species with putative orthologs and a pairwise identity score.
- SeqAPASS Level 2 Analysis (Functional Domain):
- Define the critical functional domain (e.g., the region of PRNP that interacts with PrPSc; the receptor-binding domain of ACE2).
- SeqAPASS evaluates conservation of this specific domain across identified orthologs.
- SeqAPASS Level 3 Analysis (Critical Residues):
- Input the specific amino acid residues known to be essential for the MIE (e.g., key residues for PrP binding or viral spike protein interaction).
- The tool evaluates the conservation of these exact residues across species.
- Data Integration: Combine results from all three levels. High confidence in structural conservation across Levels 1-3 provides strong evidence for the biological plausibility of the MIE in that species, supporting its inclusion in the tDOA for the associated AOP.
SeqAPASS Workflow for tDOA
Objective: To characterize and differentiate prion strains based on their biological properties in an animal model. Method:
- Inoculum Preparation: Homogenize brain tissue from a TSE-affected donor in sterile phosphate-buffered saline to create a standardized inoculum.
- Host Selection: Use panels of inbred or transgenic mice with defined Prnp genotypes (e.g., expressing mouse, hamster, or human PrPC). The host genotype is a critical variable in strain expression.
- Intracerebral Inoculation: Anesthetize mice and inoculate a precise volume (typically 20-30 µL) of the homogenate into the brain parenchyma using a stereotactic apparatus.
- Clinical Monitoring: Monitor animals regularly for the onset of clinical signs, which include ataxia, kyphosis, hind-limb paresis, and lethargy. Record the incubation period (time from inoculation to terminal disease).
- Terminal Analysis: At the clinical endpoint, perform necropsy.
- Histopathology: Fix brain sections in formalin. Process, embed in paraffin, section, and stain with Hematoxylin & Eosin (H&E). Analyze the distribution and severity of spongiform degeneration (vacuolation) and astrogliosis in specific brain regions (e.g., cortex, hippocampus, thalamus, brainstem). This lesion profile is a primary strain-typing criterion.
- Biochemical Analysis: Homogenize brain tissue. Treat with proteinase K to digest PrPC. Use western blot to analyze the resistant PrPSc. Strain-specific differences are often revealed in the glycoform ratio (relative amounts of di-, mono-, and unglycosylated PrP) and the fragment size after digestion.
- Strain Interpretation: A unique prion strain is defined by a stable combination of incubation period in a given host genotype, clinical signs, histopathological lesion profile, and biochemical PrPSc properties.
The Scientist's Toolkit: Research Reagent Solutions
Table 3: Essential Reagents for Non-Cellular Life Research
| Reagent / Material | Function & Application in Research | Key Consideration / Specification |
|---|---|---|
| Proteinase K | Selective digestion of normal cellular prion protein (PrPC) while leaving the misfolded PrPSc largely intact. Fundamental for prion detection and purification [67] [68]. | Activity must be validated for prion work; used in standard Western blot protocols to distinguish PrPC from PrPSc. |
| PLAAC Algorithm & Software | Bioinformatics tool for de novo prediction of prion-like domains (PrDs) in protein sequences based on amino acid composition [71]. | Requires FASTA format protein sequences. Alpha parameter (0.0-1.0) controls background frequency model. |
| SeqAPASS Online Tool | A bioinformatics platform to assess structural conservation of proteins across species via three-tiered analysis (full sequence, domain, critical residues) [23]. | Critical for defining the Taxonomic Domain of Applicability (tDOA) for AOPs involving host-pathogen interactions. |
| Panel of Transgenic Mouse Lines | In vivo models expressing different species' versions of the prion protein (PrPC) or with targeted gene knockouts (e.g., Prnp⁰/⁰). Essential for prion strain typing, transmission barrier studies, and investigating the essential role of PrPC [67] [69]. | Genetic background must be isogenic for consistent results. Required for essentiality tests in AOP development. |
| Monoclonal Antibodies (e.g., 6H4, 3F4) | Immunodetection of prion proteins (PrPC and PrPSc) in techniques like immunohistochemistry, Western blot, and ELISA. Some antibodies can distinguish between conformations [68]. | Specificity for epitopes that are exposed in either native or denatured PrP is crucial for different assays. |
| SYBR Green I / DAPI | Fluorescent nucleic acid stains for microscopy-based detection and enumeration of viral particles or microbial cells, often in environmental samples [72]. | Can bind to non-cellular particles; requires complementary methods (e.g., deep learning image analysis) for reliable discrimination [72]. |
| Deep Learning Cell Recognition Software (e.g., custom YOLO/ResNet models) | To automate and improve accuracy in distinguishing microbial cells from non-cellular fluorescent particles in complex samples like sediments [72]. | Requires training on large, expert-annotated datasets of microscopic images. |
The classification of viruses, prions, and boundary entities remains one of the most conceptually challenging areas in biology. Moving beyond a binary "life" vs. "non-life" debate requires a shift towards functional and mechanistic classification systems. The AOP framework, with its focus on modular Key Events and causal relationships, provides a powerful tool for this purpose. It allows researchers to deconstruct the pathogenesis of these entities into conserved, measurable steps, from the initial Molecular Initiating Event to the final Adverse Outcome. Integrating modern bioinformatic tools like SeqAPASS to define the tDOA, and computational methods like PLAAC to discover functional prion-like domains, enables a more evidence-based, predictive understanding of their biology. This approach not only clarifies taxonomic boundaries but also directly facilitates applied research in drug development and toxicological risk assessment by identifying conserved, targetable pathways across species.
The translational gap, often termed the "Valley of Death," represents the systemic failure to convert basic scientific discoveries into safe and effective clinical applications [73] [74]. In drug development, this is evidenced by a 90% failure rate for novel therapies entering clinical trials, with an average development timeline of 10-15 years and costs exceeding $2.6 billion per approved drug [73] [74] [75]. A primary driver of this gap is the limited predictive validity of traditional preclinical models, which often fail to accurately recapitulate human disease biology and patient population heterogeneity [73] [76].
This whitepaper frames the challenge within the context of Adverse Outcome Pathway (AOP) research. The AOP framework provides a structured, mechanistic description of the sequence of biological events leading from a molecular perturbation to an adverse outcome relevant to risk assessment [21]. A critical component of this framework is defining the taxonomic Domain of Applicability (tDOA)—the range of species, life stages, and sexes for which the pathway is biologically plausible [77]. This document argues that a rigorous, AOP-informed approach to defining domain applicability for preclinical constructs is fundamental to bridging the translational gap and improving the prediction of clinical outcomes.
The Scale of the Challenge: Quantitative Analysis of Translational Attrition
The disconnect between preclinical promise and clinical success is quantifiable across multiple dimensions. The following table summarizes the core economic and success-rate challenges facing modern drug development.
Table 1: Quantitative Landscape of Drug Development Attrition
| Metric | Value/Rate | Key Implication |
|---|---|---|
| Average Development Cost | $2.6 billion per approved drug [74] [75] | Extreme financial risk necessitates high predictive accuracy in early stages. |
| Average Development Timeline | 10-15 years from discovery to market [73] [75] | Slow feedback loops delay learning and increase opportunity cost. |
| Overall Attrition Rate | 90% of novel therapies fail in clinical trials [73] [75] | Highlights a fundamental breakdown in preclinical prediction. |
| Phase III Failure Rate | Approximately 50% of experimental drugs fail [74] | Late-stage failures are the most costly, indicating flawed early go/no-go decisions. |
| Translational Yield | < 0.1% of projects move from preclinical research to an approved drug [74] | Emphasizes the extreme selectivity required for success. |
| Biomarker Translation | < 1% of published cancer biomarkers enter clinical practice [76] | Demonstrates a specific crisis in translating mechanistic research into clinical tools. |
The primary causes of failure are a lack of clinical efficacy (50-60%) and unanticipated toxicity (30%), reasons that should ideally be identified in robust preclinical studies [74]. This attrition is compounded by the biological mismatch between traditional animal models and human patients, including differences in genetics, immune systems, metabolism, and disease pathophysiology [73] [76].
The AOP Framework as a Structuring Paradigm
The Adverse Outcome Pathway (AOP) framework, managed within the AOP-Wiki knowledge base, offers a standardized structure to organize mechanistic knowledge for translational research [35] [21]. An AOP is a linear sequence beginning with a Molecular Initiating Event (MIE), progressing through measurable Key Events (KEs), and culminating in an Adverse Outcome (AO) of regulatory relevance [21]. The strength of an AOP lies in its modularity and the explicit definition of Key Event Relationships (KERs), which describe the causal and predictive linkages between events [21].
A pivotal concept for translation is the taxonomic Domain of Applicability (tDOA). The tDOA defines the biological taxa (species, families, etc.) for which the KEs and KERs of an AOP are considered valid [77]. Establishing the tDOA requires empirical evidence from specific models and in silico tools (e.g., SeqAPASS) to assess the conservation of molecular targets and pathways across species [77]. This formal process moves beyond assuming translatability and instead requires evidence for it, directly addressing a root cause of the translational gap.
The following diagram illustrates the core AOP structure and the critical process of defining taxonomic applicability.
Diagram: AOP Structure and Taxonomic Domain of Applicability. The linear AOP cascade (yellow/red nodes) is informed by evidence defining its valid taxonomic domain (green ellipse), a critical step for translational relevance.
Analysis of Current AOP Development and Research Gaps
A comprehensive mapping of the AOP-Wiki database reveals thematic concentrations and significant research gaps. The following table categorizes the current focus of AOP development based on disease and biological system areas [35].
Table 2: Mapping of AOP-Wiki Focus Areas and Identified Gaps
| Disease/Biological System Category | Relative Representation in AOP-Wiki | Notable Gaps & Research Needs |
|---|---|---|
| Genitourinary System Diseases | High | Need for AOPs linking specific molecular perturbations to chronic outcomes like fibrosis. |
| Neoplasms (Non-genotoxic Carcinogenesis) | High | Under-representation of AOPs for metastasis and tumor microenvironment interactions. |
| Developmental Anomalies | High | Lack of AOPs for subtle neurodevelopmental and metabolic programming effects. |
| Immunotoxicity | Moderate (Priority Area) | Gaps in AOPs for immunosuppression, hypersensitivity, and developmental immunotoxicity. |
| Developmental & Adult Neurotoxicity | Moderate (Priority Area) | Need for AOPs based on human-relevant in vitro models and functional outcomes. |
| Endocrine & Metabolic Disruption | Moderate (Priority Area) | Sparse AOP networks for complex metabolic syndrome and multi-organ effects. |
| Cardiotoxicity & Hepatotoxicity | Lower than expected | Despite clinical importance, mechanistic AOPs for chronic drug-induced injury are limited. |
| Complex Age-Related Diseases | Very Low | Few AOPs for neurodegenerative (e.g., Alzheimer's) or chronic fibrotic diseases [73]. |
This analysis indicates that while AOP development is growing, it remains uneven. Significant gaps exist for complex chronic diseases, which are major targets for pharmaceutical intervention. Furthermore, the FAIRness (Findability, Accessibility, Interoperability, Reusability) of AOP data is crucial for its integration into larger translational workflows and computational models [35].
Modern Approaches to Bridge the Gap
Closing the translational gap requires moving beyond conventional models. The following integrated strategies are essential.
Adoption of Human-Relevant Preclinical Models
Traditional animal models and 2D cell cultures are insufficient for predicting human responses [73] [76]. Advanced models that better capture human physiology include:
- Patient-Derived Xenografts (PDX): Tumors engrafted into immunodeficient mice that retain patient-specific histology and genetics, offering superior predictive value for oncology biomarker validation [76].
- 3D Organoids: Self-organizing, patient-derived 3D structures that model organ biology and disease states, useful for personalized therapy prediction and biomarker discovery [73] [76].
- 3D Co-culture Systems: Incorporate multiple cell types (e.g., immune, stromal) to model the complex interactions of the tumor or tissue microenvironment [76].
Integration of Multi-Omics and Functional Validation
A single biomarker is rarely predictive. Integrative strategies are needed:
- Multi-Omics Profiling: Concurrent genomics, transcriptomics, proteomics, and metabolomics analysis identifies context-specific, clinically actionable biomarker signatures rather than single, often noisy, targets [76].
- Longitudinal Sampling: Repeated biomarker measurement over time captures dynamic disease or treatment response trajectories, providing more robust data than single time-point snapshots [76].
- Functional Assays: Moving beyond correlative presence to demonstrating a biomarker's active role in a biological process (e.g., using CRISPR inhibition/activation) strengthens the case for its clinical utility [76].
Data Science and Artificial Intelligence
AI and machine learning transform large, complex datasets into predictive insights.
- Pattern Recognition: AI algorithms can identify subtle, multi-parametric signatures in preclinical omics data that predict clinical efficacy or toxicity, outperforming traditional analyses [76] [75].
- Cross-Species Data Integration: Tools like cross-species transcriptomic analysis align data from animal models and human samples to identify conserved pathways and highlight discordant, species-specific signals [76].
- In Silico Modeling & Simulation: Platforms like BIOiSIM use AI to simulate a drug's pharmacokinetics and pharmacodynamics across species, generating a Translational Index to prioritize candidates with the highest probability of human success [75].
The following diagram synthesizes these modern approaches into a cohesive biomarker translation strategy.
Diagram: Integrated Strategy for Translational Biomarker Development. Modern approaches form an iterative cycle where human-relevant models and multi-omics feed functional and computational analysis, ultimately converging on a qualified clinical biomarker.
Detailed Experimental Protocols
Protocol: Establishing a PDX Model for Oncology Biomarker Validation
This protocol outlines steps for creating and using PDX models to assess predictive biomarkers [76].
- Sample Acquisition & Processing: Obtain fresh tumor tissue from patient biopsies or resections under IRB-approved protocols. Mince tissue into ~2 mm³ fragments in cold, serum-free medium.
- Implantation: Surgically implant 1-2 fragments subcutaneously or orthotopically into immunodeficient mice (e.g., NSG). Use Matrigel to enhance engraftment if necessary.
- Model Expansion & Banking: Upon tumor growth (~500-1000 mm³), harvest, and passage to subsequent mouse cohorts to expand the model. Cryopreserve early-passage tumor fragments in a dedicated biobank.
- Drug Efficacy & Biomarker Study: Randomize mice bearing passage 3-5 tumors into treatment and control groups. Administer the investigational drug per preclinical pharmacokinetic data. Monitor tumor volume.
- Longitudinal Sampling: At baseline, mid-treatment, and endpoint, collect blood via submandibular bleed for circulating biomarker analysis (e.g., ctDNA). Perform non-invasive imaging (e.g., MRI, PDG-PET) if applicable.
- Endpoint Analysis: Harvest tumors. One portion is formalin-fixed for IHC analysis of biomarker expression (e.g., phosphorylated target protein). Another is snap-frozen for multi-omics analysis (RNA-seq, proteomics) to identify response signatures.
- Data Correlation: Correlate baseline and on-treatment biomarker levels (from tissue, blood, imaging) with tumor growth inhibition metrics. Use statistical modeling to define biomarker thresholds predictive of response.
Protocol: AOP-Informed Cross-Species Transcriptomic Analysis
This protocol uses computational tools to assess the taxonomic domain applicability of a toxicity pathway [77] [76].
- Define AOP KEs: Identify the specific Key Events (e.g., "Nuclear receptor activation," "Cellular hypertrophy") for the AOP of interest from the AOP-Wiki.
- Extract Gene/Protein Lists: For each KE, compile a list of associated genes/proteins from the AOP-Wiki evidence or linked databases (e.g., Gene Ontology).
- Acquire Transcriptomic Data: Obtain RNA-sequencing datasets from relevant tissues of treated and control animals (e.g., rat, mouse) and from human in vitro models (e.g., primary cells, organoids) exposed to the same stressor class.
- Differential Expression Analysis: Perform standardized bioinformatics analysis (alignment, quantification, differential expression) for each species/model independently to identify significantly perturbed genes.
- Conservation Analysis with SeqAPASS: Input the KE-associated gene/protein sequences into the SeqAPASS tool. This tool performs pairwise sequence alignment and homology modeling to predict the probability of interaction with the stressor across hundreds of species.
- Pathway Enrichment Comparison: Use tools like GSEA to identify enriched biological pathways in the differentially expressed gene sets from each species. Compare the overlap between the rat/mouse pathway perturbations and the human model pathway perturbations.
- Define tDOA: Synthesize evidence. High sequence homology in SeqAPASS plus conserved pathway enrichment in transcriptomic data supports a broader tDOA (e.g., "plausible across mammals"). Divergent results narrow the tDOA to specific taxa or indicate the pathway is not conserved in standard rodent models for that endpoint.
The Scientist's Toolkit: Essential Research Reagents & Platforms
Table 3: Key Research Reagent Solutions for Translational Studies
| Item/Platform | Category | Primary Function in Translational Research |
|---|---|---|
| Patient-Derived Xenograft (PDX) Models | In Vivo Model | Provides an in vivo platform that retains patient tumor genetics and heterogeneity for evaluating drug efficacy and validating predictive biomarkers in an interactive biological system [76]. |
| Organoid Culture Matrices (e.g., BME, Matrigel) | 3D Culture Reagent | Provides a biologically active scaffold that supports the self-organization and growth of patient-derived cells into 3D organotypic structures for disease modeling and drug screening [73] [76]. |
| Immunodeficient Mouse Strains (NSG, NOG) | Animal Model | Engineered mouse strains lacking adaptive immune function, essential for engrafting and studying human tissues (PDXs, immune system reconstitution) without rejection [76]. |
| Multi-Omics Profiling Kits (RNA-seq, Proteomics Panels) | Molecular Profiling | Standardized kits for simultaneous extraction and analysis of multiple molecular layers (genome, transcriptome, proteome) from limited preclinical samples to generate integrated biomarker signatures [76]. |
| SeqAPASS (Sequence Alignment to Predict Across Species Susceptibility) | In Silico Tool | A bioinformatics tool that uses protein sequence homology to predict the taxonomic domain of applicability for molecular initiating events and key events within an AOP framework [77]. |
| AI/ML Simulation Platforms (e.g., BIOiSIM) | Computational Platform | Integrates physicochemical, pharmacokinetic, and toxicogenomic data to simulate drug behavior across species, generating a predictive index for human clinical outcomes and de-risking candidate selection [75]. |
Bridging the translational gap requires a fundamental shift from linear, siloed development to an integrated, iterative, and evidence-based strategy. The AOP framework provides the necessary mechanistic rigor, particularly through the formal assessment of taxonomic Domain of Applicability, to ground preclinical constructs in biologically plausible translatability.
Successful integration hinges on several strategic pillars:
- Organizational Realignment: Forming cross-functional teams that unite discovery biologists, translational scientists, clinicians, and data analysts from project inception to ensure clinical intent guides preclinical model and endpoint selection [78].
- Investment in Human-Relevant Systems: Prioritizing resource allocation to advanced models (organoids, microphysiological systems, PDX) that are characterized against human disease biology and linked to specific AOPs [76] [78].
- Data-Driven, Phase-Appropriate Decision Gates: Implementing stage-gate frameworks where go/no-go decisions are informed by rigorous tDOA analysis, biomarker qualification, and AI-powered simulation data, not just traditional animal efficacy alone [75] [78].
- Emphasis on FAIR Data Principles: Ensuring all preclinical data—especially that supporting AOPs and model validation—is Findable, Accessible, Interoperable, and Reusable to build a cumulative knowledge base that accelerates future translation [35].
By anchoring preclinical research in the taxonomically defined, mechanistic pathways of the AOP framework and leveraging modern human-relevant models and data science, the drug development community can systematically narrow the translational gap. This will increase the probability of clinical success, reduce late-stage attrition, and ultimately deliver safer, more effective therapies to patients with greater efficiency.
Overcoming Limitations in Protein-Domain Mapping for Multi-Domain Targets and Complexes
Accurately determining the three-dimensional structure of multi-domain proteins and their complexes is a fundamental challenge with direct implications for understanding biological function and designing targeted therapeutics [79]. These proteins, which constitute the majority in prokaryotic and eukaryotic proteomes, perform higher-order functions through specific domain-domain interactions [80]. However, their inherent flexibility and the paucity of full-length experimental templates have historically limited the accuracy of both experimental determination and computational prediction [79] [81].
This challenge is acutely relevant within the Adverse Outcome Pathway (AOP) framework. An AOP describes a sequential chain of causally linked events, from a Molecular Initiating Event (MIE)—often a chemical interacting with a specific protein target—to an Adverse Outcome (AO) relevant to risk assessment [21]. The taxonomic domain of applicability (tDOA) of an AOP, which defines the species in which the pathway is biologically plausible, hinges critically on the conservation of these protein targets and their interacting domains across species [23]. Therefore, limitations in mapping the structures and interactions of multi-domain proteins directly translate to uncertainties in defining the tDOA, hindering the reliable extrapolation of toxicological risk from model organisms to untested species.
This technical guide synthesizes recent breakthroughs in computational and integrative methodologies designed to overcome these mapping limitations. We detail core protocols, present quantitative performance benchmarks, and frame these advances within the workflow of AOP development, demonstrating how enhanced protein-structure prediction empowers more confident and broad taxonomic application of mechanistic toxicological knowledge.
Core Methodologies and Quantitative Benchmarks
Recent advances have moved beyond end-to-end single-chain prediction by adopting a divide-and-conquer strategy. This involves segmenting a protein sequence into domains, predicting high-accuracy structures for individual domains, and then reassembling them using optimized algorithms focused on inter-domain orientations [79] [80]. The following table summarizes the performance of two leading deep-learning-integrated assembly methods against standard benchmarks.
Table 1: Performance Comparison of Multi-Domain Protein Structure Prediction Methods
| Method (Year) | Core Strategy | Test Set | Key Metric vs. AlphaFold2 | Performance Highlight |
|---|---|---|---|---|
| DeepAssembly (2023) [79] | Domain segmentation, inter-domain interaction prediction via deep learning (AffineNet), population-based evolutionary assembly. | 219 non-redundant multi-domain proteins. | Average TM-score: 0.922 vs. 0.900. Average RMSD: 2.91 Å vs. 3.58 Å. | Improves inter-domain distance precision by 22.7%. Corrects 13.1% of low-confidence AF2 multi-domain models. |
| D-I-TASSER (2025) [80] | Hybrid deep learning & physics-based force fields; iterative domain splitting/reassembly guided by domain-level & inter-domain restraints. | 500 non-redundant "Hard" single domains (SCOPe/PDB). | Average TM-score: 0.870 vs. 0.829 (AF2.3). | Outperforms AF2/3 on single & multi-domain targets; folds 73% of full-chain human proteome sequences. |
| PINE (2020) [81] | Rigid-body docking with reranking using protein-protein interaction residue pair scores (Sppi) in absence of templates. | 55 two-domain proteins. | Success Rate: 90.9% (50/55 targets) in predicting acceptable structure (RMSD < 10Å). | Demonstrates utility of PPI interface data for domain reorganization without homologous templates. |
Experimental Protocol: The DeepAssembly Workflow
The DeepAssembly protocol exemplifies the modern, data-driven approach to multi-domain and complex assembly [79].
- Input and Domain Segmentation: The process begins with the input protein sequence. A domain boundary predictor is used to split the sequence into putative single-domain segments.
- Single-Domain Structure Prediction: Each single-domain sequence is processed by a remote template-enhanced structure predictor (e.g., a modified AlphaFold2 integrated with PAthreader for template recognition) to generate high-accuracy tertiary structures.
- Feature Extraction and Inter-Domain Interaction Prediction: Deep multiple sequence alignments (MSAs) are constructed, and templates are searched. Features from MSAs, templates, and domain boundary information are fed into a deep neural network called AffineNet. This network, built on a self-attention mechanism, is specifically trained to predict inter-domain interactions.
- Initial Assembly and Iterative Optimization: An initial full-length model is created by connecting the single-domain structures. A population-based evolutionary algorithm then performs iterative rotation angle optimization on the domains. This simulation is driven by an atomic coordinate deviation potential derived from the predicted inter-domain interactions.
- Model Selection: Finally, an in-house model quality assessment protocol selects the best model from the optimized population as the final predicted structure for the multi-domain protein or complex.
Diagram 1: DeepAssembly multi-domain prediction workflow (85 characters)
Experimental Protocol: The PINE Scoring Method
For contexts where homologous templates are unavailable, the PINE method provides a template-free scoring approach for domain assembly [81].
- Problem Setup and Docking: The known structure of a two-domain protein is separated into its individual domain structures at the linker region. A rigid-body docking tool (e.g., MEGADOCK) is used to generate thousands of possible domain-domain docking poses.
- PINE Score Calculation: Each generated pose is scored using the PINE scoring function, a weighted sum of four terms:
- Szrank: A binding energy score based on van der Waals, electrostatic, and desolvation energies.
- Sete: An inter-domain distance score based on statistical likelihood given the linker length.
- Sppi (Novel Term): An interaction residue pair score. This uses known protein-protein interaction interfaces to predict likely domain-domain interaction surfaces without a homologous template.
- Sdock (Novel Term): The original docking score from the rigid-body docking calculation.
- Reranking and Success Criteria: The generated models are reranked based on their PINE score. A prediction is considered successful if a model with a root-mean-square deviation (RMSD) within 10 Å of the native structure is found among the top 10 ranked poses.
Integration with the AOP Framework: From Protein Structure to Taxonomic Applicability
The AOP framework organizes toxicological knowledge into causal pathways linking a Molecular Initiating Event to an Adverse Outcome [21]. Confidence in extrapolating an AOP across species depends on defining its taxonomic domain of applicability (tDOA), which rests on evidence for the conservation of Key Events (KEs) and their relationships [23].
Table 2: AOP Terminology and Role of Protein Structure Mapping [21] [23]
| AOP Component | Definition | Role of Protein-Domain Mapping |
|---|---|---|
| Molecular Initiating Event (MIE) | Initial interaction of a stressor with a biomolecule (e.g., protein). | Identifies and characterizes the precise 3D binding site or interface where the stressor acts. |
| Key Event (KE) | Measurable, essential biological change. | Many KEs involve protein-protein interactions or allosteric changes in multi-domain proteins. Accurate structure models these processes. |
| Key Event Relationship (KER) | Scientifically supported causal link between an upstream and downstream KE. | Provides mechanistic, structural plausibility for how perturbation at one point propagates (e.g., via domain reorientation). |
| Taxonomic Domain of Applicability (tDOA) | The species for which the AOP is considered biologically plausible. | Foundational. Structural bioinformatics compares query protein domains/active sites across species to infer conservation of MIE/KEs. |
Accurate models of multi-domain proteins are critical for evaluating the biological plausibility of KERs and for using bioinformatics tools to define the tDOA. The SeqAPASS tool, for example, uses a hierarchical approach to assess the conservation of protein targets across species [23]:
- Level 1: Compares primary amino acid sequence similarity.
- Level 2: Evaluates conservation of functional domains.
- Level 3: Assesses conservation of individual amino acid residues critical for interaction (e.g., ligand binding, protein-protein interfaces).
High-accuracy structural models, especially of interaction interfaces, directly inform Level 2 and Level 3 analyses, enabling a robust, structure-based argument for the taxonomic breadth of an AOP.
Diagram 2: AOP components and taxonomic applicability (78 characters)
Protocol: Defining tDOA Using Structural Bioinformatics (SeqAPASS)
This protocol, based on a case study of an AOP linking nicotinic acetylcholine receptor activation to colony failure in bees, outlines how to computationally expand tDOA evidence [23].
- Identify AOP Protein Targets: Extract the list of proteins involved in the critical KEs of the AOP (e.g., the receptor protein for the MIE, proteins involved in downstream signaling KEs).
- Perform SeqAPASS Analysis: For each query protein, submit its sequence to the SeqAPASS tool.
- Level 1 Analysis: Identify putative orthologs across a broad taxonomic range based on overall sequence similarity.
- Level 2 Analysis: Examine the conservation of specific protein domains and functional motifs in the identified orthologs.
- Level 3 Analysis: Investigate the conservation of individual amino acid residues known to be critical for function (e.g., from the multi-domain structure model: ligand-binding residues, residues at a domain-domain interface crucial for signal transduction).
- Synthesize Evidence for tDOA: Integrate results across all AOP-relevant proteins. Strong conservation at Levels 2 and 3 across a taxonomic group provides compelling structural evidence for the biological plausibility of the AOP in those species. This computational evidence can be combined with existing empirical data to define and justify the proposed tDOA in the AOP-Wiki.
Diagram 3: Taxonomic domain assessment via bioinformatics (70 characters)
The Scientist's Toolkit: Essential Research Reagent Solutions
Table 3: Key Software and Resources for Protein-Domain Mapping & AOP Development
| Tool/Resource | Type | Primary Function in Domain Mapping/AOPs | Reference/Source |
|---|---|---|---|
| AlphaFold2/3 | Deep Learning Model | Provides high-accuracy baseline structures for single domains and some complexes; a common starting point for comparison. | DeepMind / EBI [79] [80] |
| DeepAssembly | Computational Pipeline | Specialized for assembling multi-domain proteins & complexes using predicted inter-domain interactions. | [79] |
| D-I-TASSER | Hybrid Prediction Pipeline | Integrates deep learning with physics-based simulation for single and multi-domain prediction; includes domain splitting/reassembly. | [80] |
| PINE Score | Scoring Function | Enables template-free ranking of domain-domain docking poses using PPI-derived residue pair information. | [81] |
| SeqAPASS | Bioinformatics Tool | Evaluates sequence and structural conservation of proteins/domains/residues across species to inform AOP tDOA. | US EPA [23] |
| PAthreader | Remote Template Recognition | Improves single-domain structure prediction by detecting distantly related folds, feeding into assembly pipelines. | Integrated in DeepAssembly [79] |
| MEGADOCK, ZDOCK | Rigid-Body Docking Engine | Generates candidate poses for domain-domain or protein-protein assembly. | [81] |
| AOP-Wiki | Knowledgebase | The central repository for developing, sharing, and assessing AOPs. Provides the framework for documenting tDOA. | OECD [21] [27] |
The translation of biomedical research into reliable drug development and regulatory decisions is fundamentally compromised by ambiguity in outcome classification. In clinical trials, inconsistent definitions, measurement timing, and analysis of primary endpoints introduce variability that obscures true treatment effects, inflates research waste, and undermines evidence-based decision-making [82]. Concurrently, in mechanistic toxicology and pharmacology, the Adverse Outcome Pathway (AOP) framework organizes knowledge into causal sequences from a Molecular Initiating Event (MIE) to an Adverse Outcome (AO) [21]. The utility of AOPs for cross-species extrapolation and chemical safety assessment hinges on the precise definition and empirical support for each Key Event (KE) and Key Event Relationship (KER) [23]. Ambiguity in defining these biological events propagates uncertainty throughout the pathway, limiting confidence in its taxonomic domain of applicability (tDOA)—the range of species for which the AOP is biologically plausible [23].
This guide posits that principles for ensuring consistency in clinical outcome classification, as codified in standards like CONSORT and SPIRIT, provide a critical template for strengthening the AOP framework, particularly in defining tDOAs. By adopting similar rigor in defining, measuring, and reporting KEs, researchers can construct more reliable and universally interpretable AOPs, thereby bridging high-throughput mechanistic data with apical outcomes relevant to human and ecological health.
Foundational Frameworks: AOPs and the Imperative for Taxonomic Clarity
The AOP framework is a structured representation of existing knowledge linking a direct chemical perturbation (MIE) to an AO at the organism or population level through a series of biologically plausible and essential intermediate KEs [21]. KEs are measurable changes in biological state, and KERs describe the causal linkages between them [21]. AOPs are modular and chemical-agnostic; their value lies in supporting prediction and cross-species extrapolation based on conserved biology [27].
A core challenge is defining the tDOA. An AOP developed in a model species (e.g., Apis mellifera, the honey bee) is assumed to have broader relevance, but this assumption requires validation [23]. The tDOA is determined by evaluating the structural and functional conservation of the entities and activities underlying each KE and KER across taxa [23]. Ambiguity in KE definition—such as vague descriptors of a cellular change or poorly quantified response thresholds—makes assessing this conservation impossible, rendering the AOP's scope uncertain and its application in regulatory decision-making risky.
Table 1: Core Definitions of the AOP Framework (Adapted from OECD Handbook) [21]
| Term | Abbreviation | Definition |
|---|---|---|
| Molecular Initiating Event | MIE | The initial interaction between a stressor and a biomolecule within an organism that triggers the pathway. |
| Key Event | KE | A measurable, essential change in biological state critical to the progression of the AOP. |
| Key Event Relationship | KER | A scientifically supported, causal relationship linking an upstream KE to a downstream KE. |
| Adverse Outcome | AO | An endpoint of regulatory significance, equivalent to an apical endpoint in a toxicity test. |
| Taxonomic Domain of Applicability | tDOA | The range of species for which there is biological plausibility that the AOP is conserved. |
The AOP development workflow, as outlined in the OECD handbook, is a systematic process that demands precision at every stage to minimize ambiguity [21]. The following diagram illustrates this generalized workflow, highlighting stages where explicit outcome definition is critical.
AOP Development and Assessment Workflow
Clinical Research Paradigms for Consistency: CONSORT and SPIRIT
The clinical trial community has long confronted the problem of ambiguous outcome reporting, which can lead to biased results and misinformed healthcare decisions [82]. The CONSORT (Consolidated Standards of Reporting Trials) statement provides a minimum set of items for transparently reporting completed randomized trials [82]. Its sister guideline, SPIRIT (Standard Protocol Items: Recommendations for Interventional Trials), provides a complementary standard for detailing all critical elements in a trial protocol before the study begins [83].
These guidelines mandate pre-specification and precise definition of outcomes to prevent ambiguity. Key requirements include:
- Defining the specific measurement variable (e.g., "trough forced expiratory volume in 1 second (FEV1)").
- Specifying the analysis metric (e.g., "change from baseline at Week 24").
- Declaring the method of aggregation (e.g., "mean difference between groups").
- Identifying the time point for each outcome assessment [82] [83].
This precision is enforced through trial registration and public protocol access, making deviations from the planned analysis transparent [82] [83]. The CONSORT participant flow diagram is a cornerstone for clarity, explicitly accounting for all participants and preventing ambiguity in the analyzed population.
Table 2: Key CONSORT 2025 & SPIRIT 2025 Items for Outcome Classification [82] [83]
| Guideline | Section | Item Number | Checklist Item Description | Purpose in Avoiding Ambiguity |
|---|---|---|---|---|
| SPIRIT 2025 | Outcomes | 14 | Prespecify primary/secondary outcomes, including measurement variable, analysis metric, aggregation method, and time point. | Eliminates "cherry-picking" of results by locking in definitions a priori. |
| CONSORT 2025 | Outcomes | 14 | As above, for the reported results. | Ensures the reported analysis aligns with the protocol, highlighting any post-hoc changes. |
| SPIRIT 2025 | Open Science | 5 | Specify where the protocol and statistical analysis plan can be accessed. | Enables external verification of pre-specification. |
| CONSORT 2025 | Open Science | 3 | As above. | Links the publication to the pre-registered plan. |
| CONSORT 2025 | Diagram | - | Provide a flow diagram documenting participant progression. | Removes ambiguity about enrollment, allocation, follow-up, and analysis numbers. |
The following diagram models the standard participant flow, a tool mandated by CONSORT to eliminate ambiguity in reporting which subjects were included in the final analysis [82].
CONSORT Participant Flow Diagram for Trial Transparency
Integrating Clinical Standards into AOP Development for Taxonomic Precision
The rigor demanded by CONSORT/SPIRIT can be directly translated to AOP development to reduce ambiguity and strengthen tDOA definitions. A KE in an AOP is analogous to an outcome in a clinical trial: it must be defined with sufficient precision to be measurable and comparable across studies and species.
1. Pre-Specification and Quantitative Definition of Key Events: Just as a clinical outcome must specify "measurement variable, metric, and time point," a KE description must move beyond qualitative statements (e.g., "oxidative stress") to quantifiable definitions. A precise KE would be: "Measurement variable: Cellular glutathione (GSH) concentration. Metric: ≥40% decrease from baseline levels. Time point: Measured after 24-hour exposure in in vitro hepatocyte model." This precision enables consistent experimental measurement and forms the basis for assessing conservation across species.
2. Evidence Categorization for Key Event Relationships: The weight of evidence for a KER should be evaluated with the transparency of a clinical systematic review. Evidence can be categorized as:
- Direct Experimental Support: Evidence from studies explicitly designed to modulate the upstream KE and observe the effect on the downstream KE (analogous to a controlled trial).
- Indirect/Correlative Support: Observational co-occurrence of KEs (analogous to epidemiological association).
- Inconsistent Evidence: Data contradicting the relationship. Documenting the quality, quantity, and consistency of this evidence for each KER is essential for grading the overall confidence in the AOP [21].
3. Defining the Taxonomic Domain of Applicability (tDOA) with Bioinformatics: Modern bioinformatics tools provide a structured, evidence-based method to define tDOA, moving beyond assumption. The SeqAPASS (Sequence Alignment to Predict Across Species Susceptibility) tool is a prime example [23]. It uses a hierarchical approach to evaluate the conservation of proteins involved in KEs:
- Level 1: Compares primary amino acid sequence similarity to identify potential orthologs.
- Level 2: Evaluates conservation of known functional domains.
- Level 3: Assesses conservation of specific amino acid residues critical for function (e.g., ligand binding sites for an MIE) [23]. This computational evidence for structural conservation can be combined with empirical toxicity data demonstrating functional conservation to rigorously define a biologically plausible tDOA [23].
Table 3: SeqAPASS Bioinformatics Protocol for Assessing Taxonomic Domain of Applicability [23]
| Level | Analysis Focus | Methodology | Output for tDOA Assessment |
|---|---|---|---|
| Level 1 | Primary Sequence Similarity | Alignment of full-length protein sequences from a query species against databases. | Identifies putative orthologous proteins in other species. Provides a broad filter for potential conservation. |
| Level 2 | Functional Domain Conservation | Analysis of the presence/absence and sequence similarity of specific functional domains (e.g., binding pockets, catalytic sites). | Determines if the molecular machinery to perform the KE's function is likely present in other species. |
| Level 3 | Critical Residue Conservation | Examination of individual amino acid residues known to be essential for the specific interaction or activity that defines the KE/MIE. | Offers the highest-resolution evidence. If critical residues are not conserved, the KE is unlikely to be operative in that taxon. |
Case Study Integration: From Clinical Data to AOP Networks
A 2024 analysis of the AOP-Wiki database mapped existing AOPs to biological processes and diseases, revealing areas of concentrated research (e.g., genitourinary system, neoplasms) and significant gaps [27]. This mapping is crucial for prioritizing development. For instance, an AOP network for developmental neurotoxicity (DNT) can be constructed by linking multiple MIEs (e.g., neurotransmitter receptor disruption, oxidative stress) to the AO of "impaired cognitive function." [27].
The connection to clinical research is direct: the AO "impaired cognitive function" must be defined with clinical trial-level precision (e.g., "a ≥ 1 standard deviation decrease in the IQ score of a standardized test at age 7"). The contributing KEs (e.g., "reduced neuronal migration," "altered synaptic density") must be equally precise. Data from human cohort studies, animal models, and in vitro assays inform the KERs. Crucially, the tDOA for each segment of this network will vary. The MIE "activation of the nicotinic acetylcholine receptor" may be broadly conserved across vertebrates and invertebrates, as demonstrated in a bee case study using SeqAPASS [23]. However, a downstream KE like "altered cortical lamination" is only applicable to species with a layered neocortex. Explicit, precise definition of each KE is what allows for this nuanced, accurate mapping of taxonomic applicability, preventing the over-extension of AOP predictions.
The Scientist's Toolkit: Essential Reagents and Materials for Implementation
Table 4: Research Reagent Solutions for Consistent Outcome Classification
| Item/Category | Function/Description | Role in Ensuring Consistency |
|---|---|---|
| Certified Reference Materials & Assay Kits | Standardized biochemicals, cell lines, and validated assay kits (e.g., for glutathione, cytokine ELISA, kinase activity). | Provides a common benchmark for measuring KE-related biomarkers, reducing inter-laboratory variability. |
| Bioinformatics Databases & Tools | • UniProt/NCBI Protein: Sequence databases.• SeqAPASS Tool: For tDOA analysis [23].• Gene Ontology (GO): For functional annotation [27]. | Enables standardized analysis of structural conservation and biological process mapping for AOP development. |
| Reporting Guideline Checklists | CONSORT 2025 [82], SPIRIT 2025 [83], and AOP Developer's Handbook [21] checklists. | Serves as a procedural guide to ensure all critical information for reproducibility and transparency is captured. |
| Trial & Protocol Registries | ClinicalTrials.gov, WHO ICTRP, EPA's AOP-Wiki. | Public pre-registration of study plans (for trials or AOPs) locks in definitions and methods, combating hindsight bias. |
| Standardized Data Formats | ISA-TAB, CDISC standards (for clinical data), structured data templates for AOP-Wiki entries. | Promotes interoperability and reuse of data by ensuring it is organized with consistent metadata. |
Ambiguity in outcome classification is a pervasive source of uncertainty that undermines both clinical research and mechanistic pathway-based approaches like the AOP framework. The solution lies in the adoption of a unified culture of precision, transparency, and pre-specification. Clinical research standards like CONSORT and SPIRIT provide a proven model. By applying these principles—precise definition of measurement variables, pre-registration of analysis plans, and structured reporting—to the development of AOPs, researchers can construct more robust and reliable knowledge frameworks.
This integration is most powerful in defining the taxonomic domain of applicability. A precisely defined KE, supported by bioinformatics evidence of structural conservation and empirical evidence of function, allows for confident extrapolation across species. This rigor transforms AOPs from qualitative diagrams into quantitative, predictive tools that can effectively support next-generation risk assessment, reduce reliance on animal testing, and accelerate the development of safer chemicals and therapeutics. The path forward requires collaborative discipline: clinicians, toxicologists, and bioinformaticians must jointly commit to the consistent standards that turn data into definitive knowledge.
Evaluating and Comparing Frameworks: Strengths, Evidence, and Integration
The Adverse Outcome Pathway (AOP) framework provides a structured mechanistic representation of critical biological toxicity pathways, connecting molecular initiating events to adverse organism-level outcomes. Within this paradigm, accurate taxonomic classification is not merely an academic exercise but a foundational prerequisite for reliable translational toxicology. The choice of a biological classification system—whether the Linnaean hierarchy, the Two-Empire dichotomy, or the Eocyte-derived two-domain hypothesis—directly influences the selection of model organisms, the interpretation of conserved molecular pathways, and the extrapolation of molecular initiating events across species.
This analysis contends that the ongoing evolution from phenotypic to genomic classification mirrors the needs of AOP development. Just as AOPs seek to define conserved key events across levels of biological organization, modern phylogenetic systems aim to map the evolutionary conservation of genes and pathways. The debate between the three-domain and two-domain systems of life, for instance, has profound implications for understanding the fundamental unity and divergence of core cellular processes—such as DNA replication, protein synthesis, and membrane function—that are frequently the targets of chemical stressors. This guide provides a technical comparison of these systems, details the experimental methodologies that underpin them, and discusses their relevance for research aimed at building predictive toxicological frameworks across the tree of life.
Core Principles and Historical Development of Each System
The Linnaean System: A Hierarchical, Phenotype-Based Framework
Developed by Carl Linnaeus in the 18th century, this system introduced a binomial nomenclature (genus and species) and a ranked hierarchy (Kingdom, Class, Order, Genus, Species) for organizing life based on observable physical traits [84]. Linnaeus's original classification divided life into three kingdoms: Regnum Animale (animals), Regnum Vegetabile (plants), and Regnum Lapideum (minerals) [84]. For plants, his "Sexual System" classified organisms based on the number and arrangement of stamens and pistils (e.g., Classis 1. Monandria: flowers with 1 stamen) [84]. This system prioritized identifiability and practicality for cataloging biodiversity but was not based on evolutionary relationships.
The Two-Empire System: The Prokaryote/Eukaryote Dichotomy
Formalized in the mid-20th century, this system categorizes all cellular life into two fundamental groups or "empires": Prokaryota (cells without a membrane-bound nucleus) and Eukaryota (cells with a nucleus) [85]. This dichotomy, championed by biologists like Édouard Chatton and Roger Stanier, was based on the fundamental cellular organization visible through microscopy [10] [86]. It consolidated all bacteria and archaea into the Prokaryota, emphasizing their structural similarity in contrast to eukaryotes. Prominent critics of later systems, like Ernst Mayr, defended this view, arguing that the division between prokaryotes and eukaryotes represented "the single most important discontinuity in the living world" [86].
The Eocyte Hypothesis and the Two/Three-Domain Systems: A Genomic Revolution
This paradigm shift began with Carl Woese's work in the 1970s. By comparing 16S ribosomal RNA (rRNA) sequences, Woese discovered that "archaebacteria" (now Archaea) were as genetically distinct from true bacteria (Bacteria) as they were from eukaryotes [1]. This led to the 1990 proposal of the three-domain system: Archaea, Bacteria, and Eukarya, each representing a primary lineage of descent [1].
Concurrently, James Lake proposed the Eocyte hypothesis based on ribosomal structure analysis. He suggested eukaryotes did not form a sister group to Archaea but instead emerged from within them, specifically from a group he called eocytes (later classified as Thermoproteota) [87]. This implied a two-domain tree (Bacteria and Archaea) with eukaryotes as a branch within Archaea. Initially overshadowed by the three-domain model, the eocyte hypothesis has been dramatically revived by 21st-century phylogenomics. The discovery of the Asgard archaea (e.g., Lokiarchaeota, Heimdallarchaeota), whose genomes encode numerous "eukaryotic signature proteins," has provided strong support for a two-domain system where Eukarya is an archaeal lineage [10] [88].
Table 1: Comparative Overview of Classification Systems
| Feature | Linnaean System | Two-Empire System | Three-Domain System (Woese) | Two-Domain System (Eocyte) |
|---|---|---|---|---|
| Primary Basis | Observable morphology and reproduction [84] | Cellular ultrastructure (presence of nucleus) [85] | Molecular phylogeny (rRNA sequences) [1] | Molecular phylogenomics (concatenated protein genes) [88] |
| Top-Level Groups | Kingdoms (e.g., Animals, Plants) [84] | Empires: Prokaryota, Eukaryota [85] | Domains: Bacteria, Archaea, Eukarya [1] | Domains: Bacteria, Archaea (including Eukarya) [10] |
| View of Archaea | Not recognized | Grouped with Bacteria as Prokaryota [85] | Separate domain, sister to Eukarya [1] | Parent group from which Eukarya emerged [87] |
| Key Strength | Practical nomenclature; intuitive hierarchy [84] | Highlights fundamental structural divide [86] | Reflects deep evolutionary splits based on molecular data [1] | Explains shared molecular machinery between eukaryotes and archaea [10] |
| Major Limitation | Does not reflect evolutionary relationships | Ignores profound genetic diversity within prokaryotes [1] | May be an artifact of simplified phylogenetic models [88] | Requires explanation of how eukaryotic cell evolved from archaeal host [87] |
Methodological Foundations: Key Experimental Protocols
The shift from the Two-Empire to the Domain systems was driven by the adoption of molecular biology techniques. The following protocols are central to generating the data that underpin modern phylogenetic classification.
16S/18S Ribosomal RNA (rRNA) Gene Sequencing (Woese’s Method)
This foundational protocol established the three-domain tree [1] [89].
- Nucleic Acid Extraction: Total genomic DNA is isolated from a pure microbial culture or environmental sample.
- PCR Amplification: The gene encoding the 16S rRNA (in prokaryotes) or 18S rRNA (in eukaryotes) is amplified using universal or domain-specific primers targeting conserved regions.
- Cloning and Sequencing (Historical): PCR products were traditionally cloned into plasmids, transformed into E. coli, and sequenced by Sanger methods. Today, direct high-throughput sequencing of amplicons is standard.
- Sequence Alignment and Phylogenetic Analysis: Sequences are aligned using tools like SILVA or Greengenes. A phylogenetic tree is inferred using methods like maximum parsimony, neighbor-joining, or maximum likelihood, with bootstrap analysis to assess node support.
Phylogenomic Analysis for the Two-Domain Tree
This modern, large-scale protocol tests the eocyte hypothesis by analyzing multiple protein-coding genes [88].
- Genome Selection & Ortholog Identification: Select genomes across bacterial, archaeal (including Asgard), and eukaryotic lineages. Identify sets of single-copy orthologous genes present in all taxa.
- Supermatrix Construction: Align the amino acid sequences for each orthologous gene individually. Concatenate the aligned sequences into a single supermatrix.
- Model Testing and Tree Inference: Use software like PhyloBayes or IQ-TREE with the CAT+GTR model to account for site-specific compositional heterogeneity, a critical step to avoid artifacts like long-branch attraction. Perform Bayesian inference or maximum likelihood analysis on the supermatrix.
- Coalescent-Based Species Tree Estimation (Alternative): To account for incomplete lineage sorting and gene-tree/species-tree discordance, infer trees from each gene family individually and then use a coalescent method (e.g., ASTRAL) to compute the species tree.
- Statistical Testing: Use the Approximately Unbiased (AU) test or other likelihood-based methods to statistically compare the fit of the two-domain vs. three-domain tree topologies to the data.
Phylogenomic Workflow for Domain Classification
Critical Evaluation and Synthesis
Comparative Analysis of Evolutionary Relationships
The core debate centers on the placement of Eukarya. The Two-Empire system groups Archaea and Bacteria together by the absence of a trait (a nucleus), which is now viewed as phenotypically convenient but phylogenetically inaccurate [86]. The Three-Domain system treats Archaea and Eukarya as sister groups, implying shared ancestry after their divergence from Bacteria [1]. The Eocyte-based Two-Domain system posits that Eukarya are embedded within Archaea, specifically as a sister group to the Heimdallarchaeota or other Asgard archaea [10] [88]. This last model is increasingly supported by the discovery of eukaryotic signature proteins (ESPs) like actin, tubulin, and ESCRT complex components in Asgard archaeal genomes [10].
Table 2: Key Genomic Evidence Informing the Current Debate
| Evidence Type | Finding | Supports | Rationale |
|---|---|---|---|
| Ribosomal RNA | Three distinct clusters for Bacteria, Archaea, Eukarya [1]. | 3-Domain | The original, foundational molecular evidence. |
| Elongation Factors | Unique 11-amino-acid insertion shared by Eukaryotes and Crenarchaeota (Eocytes) [89]. | 2-Domain (Eocyte) | Suggests a specific shared ancestry not with all Archaea. |
| Genome Content | Eukaryotic "informational" genes (replication, transcription) are archaeal; "operational" genes (metabolism) are bacterial [89]. | Symbiogenesis | Supports a chimeric origin, compatible with 2-Domain if host was archaeal. |
| Eukaryotic Signature Proteins (ESPs) | Homologs of actin, tubulin, ESCRT proteins found in Asgard archaea genomes [10]. | 2-Domain (Asgard) | Indicates the archaeal ancestor of eukaryotes possessed key building blocks for complexity. |
| Phylogenomic Models | Under simplistic models, Archaea are monophyletic (3D). Under heterogeneous models (CAT+GTR), eukaryotes nest within Archaea (2D) [88]. | 2-Domain | Suggests the 3D tree may be an artifact of model misspecification. |
Implications for AOP and Mechanistic Biomedical Research
The classification framework directly impacts biological interpretation in translational research:
- Model Organism Selection: If eukaryotes are an archaeal lineage, then certain core cellular processes (e.g., DNA replication machinery) in human cells are fundamentally archaeal in origin. This knowledge can refine the choice of prokaryotic models for studying conserved key events.
- Understanding Pathway Conservation: The Two-Domain tree clarifies that many "eukaryotic-specific" pathways have deep archaeal roots. An AOP involving vesicle trafficking (via ESCRT proteins) or cytoskeletal dynamics may trace its molecular initiating event to a pre-eukaryotic archaeon [10].
- Horizontal Gene Transfer (HGT) Context: The chimeric nature of the eukaryotic genome (archaeal host + bacterial endosymbiont) underscores the role of HGT in major evolutionary transitions. For AOPs, this highlights that genes responsible for a key event may have diverse evolutionary histories, affecting their distribution across species.
Evolutionary Relationships Under Different Systems
The Scientist's Toolkit: Research Reagent Solutions
Table 3: Essential Reagents and Materials for Phylogenomic Classification Research
| Reagent/Material | Function in Protocol | Specific Application Example |
|---|---|---|
| Universal PCR Primers (e.g., 27F/1492R) | Amplify target rRNA genes from diverse, unknown organisms [1]. | Initial microbial diversity surveys in an environmental sample for AOP-relevant species. |
| Metagenomic Sequencing Kits (e.g., Illumina NovaSeq) | Recover genome sequences from complex environmental samples without cultivation [10]. | Obtaining genomes of uncultivated Asgard archaea from marine sediments. |
| Ortholog Prediction Software (e.g., OrthoFinder, eggNOG) | Identify single-copy orthologous genes across dozens of genomes for phylogenomic matrices [88]. | Building a dataset of conserved informational genes across bacterial, archaeal, and eukaryotic models. |
| Phylogenetic Software with Complex Models (e.g., PhyloBayes, IQ-TREE) | Perform sequence evolution modeling that accounts for site heterogeneity, composition bias, and incomplete lineage sorting [88]. | Testing the robustness of the two-domain tree topology against the three-domain alternative. |
| Cultivation Media for Fastidious Prokaryotes | Grow previously uncultivable archaea and bacteria under simulated in situ conditions. | Isolating pure cultures of Asgard archaea for experimental validation of ESP function. |
The trajectory of biological classification has moved decisively from phenotypic observation (Linnaean) to structural dichotomy (Two-Empire) to molecular phylogeny (Domains). The weight of contemporary phylogenomic evidence, accounting for sophisticated evolutionary models, now strongly supports a Two-Domain tree of life in which Eukarya is a highly derived branch of the Archaea [10] [88].
For the AOP framework, this refined evolutionary context is crucial. It provides a more accurate map of deep homology—the common ancestry of core genetic pathways that can be perturbed by chemical stressors. Future research at the intersection of taxonomy and mechanistic toxicology should:
- Systematically map the distribution of AOP-relevant molecular targets (e.g., specific receptors, enzyme families) across the Two-Domain tree.
- Utilize insights from Asgard archaeal biology to hypothesize the ancient evolutionary state of key cellular stress response pathways.
- Explicitly consider the chimeric origin of eukaryotic cells when extrapolating key event relationships between prokaryotic and eukaryotic test systems.
Ultimately, adopting the most accurate phylogenetic framework strengthens the biological plausibility of AOPs, enhancing their predictive power in ecological and human health risk assessment.
This whitepaper provides an in-depth technical guide for validating constructs within the National Institute of Mental Health's Research Domain Criteria (RDoC) framework. RDoC proposes a biology-based, dimensional alternative to categorical psychiatric diagnoses, organizing research around core behavioral domains and their underlying neurobiological systems [16]. Validation requires convergent evidence across genes, circuits, and behavior. We frame this validation challenge within the Adverse Outcome Pathway (AOP) paradigm, a structured toxicological framework for linking molecular perturbations to adverse outcomes via key events [21]. Here, we posit RDoC constructs as the functional "key events" of psychopathology. We synthesize contemporary data-driven validation methodologies, including latent variable modeling of neuroimaging data [90], systematic biomarker reviews [91], and translational psychotherapy research [46]. The paper details experimental protocols, presents quantitative findings in comparative tables, and proposes an integrated RDoC-AOP workflow for identifying and substantiating transdiagnostic mechanisms in mental health research and drug development.
The Research Domain Criteria (RDoC) is a strategic research framework initiated by the U.S. National Institute of Mental Health (NIMH) to transform the classification of mental disorders. It moves away from symptom-based categories, as exemplified by the DSM, toward a multi-dimensional system grounded in biological and behavioral constructs [16]. The framework organizes research along several core domains of human functioning (e.g., Positive Valence Systems, Negative Valence Systems, Cognitive Systems), each containing more specific constructs and sub-constructs. These are studied across multiple units of analysis, from genes and molecules to circuits, physiology, behavior, and self-reports [16] [46]. The ultimate goal is to establish valid, biologically defined phenotypes that cut across traditional diagnostic boundaries, thereby addressing the high heterogeneity and comorbidity observed in clinical populations [90].
Parallel to this, the Adverse Outcome Pathway (AOP) framework provides a complementary structure for organizing mechanistic knowledge. An AOP is a linear sequence that links a Molecular Initiating Event (MIE)—the initial interaction of a stressor with a biological target—through a series of essential, measurable Key Events (KEs), culminating in an Adverse Outcome (AO) relevant for risk assessment [21]. This conceptualization offers a powerful lens for RDoC validation: an RDoC construct (e.g., reward prediction error) can be conceptualized as a KE within a broader pathway from genetic risk or environmental insult (MIE) to psychiatric illness (AO). Validating an RDoC construct thus requires evidence for its essential, causal role in this pathway, supported by data spanning the units of analysis [21] [35].
Foundational Frameworks: RDoC Matrix and AOP Structure
The RDoC Matrix
The RDoC matrix is the primary organizational tool, with rows representing constructs and columns representing units of analysis. This structure mandates the integration of data types. For example, the "Acute Threat (Fear)" construct within the Negative Valence Systems domain is associated with specific circuits (e.g., amygdala, anterior cingulate cortex), physiological responses, behavioral paradigms (e.g., fear conditioning), and self-report measures [16]. This matrix guides researchers to test hypotheses across levels, ensuring biological and behavioral data are coherently linked.
AOP Core Principles
The AOP framework provides a standardized template for establishing causal, predictive linkages. Its core principles are directly applicable to RDoC validation [21]:
- Modularity: KEs (analogous to RDoC constructs) and Key Event Relationships (KERs) should be defined independently so they can be reused in different pathways.
- Essentiality: A KE must be empirically demonstrated as a necessary step for progression toward the AO.
- Weight of Evidence (WoE): Confidence in an AOP is evaluated based on the biological plausibility and empirical support for its KEs and KERs.
Table 1: Alignment of RDoC and AOP Framework Terminology
| RDoC Framework Term | AOP Framework Term | Comparative Description |
|---|---|---|
| Construct/Sub-construct | Key Event (KE) | A measurable, essential component of a functional or dysfunctional pathway. |
| Domain | Key Event Relationship (KER) Network | A grouping of related constructs/KEs that form a coherent biological system. |
| Genetic/Environmental Risk Factor | Molecular Initiating Event (MIE) or Stressor | The initial perturbation that triggers the pathway. |
| Psychiatric Disorder/Syndrome | Adverse Outcome (AO) | The clinically significant endpoint of the pathway. |
| Units of Analysis (Genes to Behavior) | Biological Levels of Organization | The span of evidence required to establish a credible pathway. |
Diagram 1: RDoC Constructs as Key Events in an AOP (75 characters)
Genetic and Molecular Validation Evidence
Validation at the genetic level seeks to identify variants associated with specific RDoC constructs, providing a foundation for the pathway's MIE or early KEs. A systematic mapping of the AOP-Wiki reveals that current AOPs are heavily focused on diseases of specific organ systems (e.g., genitourinary, neoplasms) [35], highlighting a relative gap for neuropsychiatric AOPs. Building these requires genetic evidence.
Protocol: Genome-Wide Association Studies (GWAS) on Intermediate Phenotypes.
- Cohort Definition: Recruit participants assessed using behavioral paradigms or physiological measures that operationalize an RDoC construct (e.g., reward learning task performance).
- Genotyping & Imputation: Perform whole-genome genotyping and impute to a dense reference panel.
- Phenotyping: Quantify the construct-derived phenotype (e.g., reward prediction error signal from computational modeling of task data).
- Association Analysis: Conduct GWAS regressing genetic variants onto the quantitative phenotype.
- Validation & Pathway Analysis: Replicate findings in an independent cohort. Perform gene-set and functional enrichment analyses to identify relevant biological pathways (e.g., dopamine receptor signaling, synaptic plasticity).
Key Evidence: While the search results lack specific new genetic associations, the RDoC matrix explicitly lists relevant molecular units (e.g., CREB, FosB, dopamine, glutamate for the "Initial Response to Reward" construct) [16]. The integration of such molecular data with genetic findings and circuit/behavioral measures is a core RDoC validation objective.
Circuit-Level Validation via Neuroimaging
The most direct validation of RDoC is demonstrating that its proposed constructs map onto distinct, measurable neural circuit functions. A 2025 latent variable analysis of task-based fMRI (tfMRI) provides critical data-driven evidence for and against the current RDoC domain structure [90].
Protocol: Data-Driven Latent Variable Modeling of tfMRI [90].
- Data Curation: Assemble a corpus of whole-brain tfMRI activation maps (e.g., 84 maps from 19 studies, N=6,192 participants). Code each map to an RDoC domain based on task description.
- Model Comparison: Test competing Confirmatory Factor Analysis (CFA) models:
- Model A (RDoC-Specific): Maps load only onto their predefined RDoC domain factors.
- Model B (RDoC-Bifactor): Maps load onto both their RDoC domain factor and a general "task-general" factor.
- Model C (Data-Driven): Use Exploratory Factor Analysis (EFA) to derive factors from the data, then fit a CFA.
- Fit Assessment: Compare model fit using indices like RMSEA, CFI, TLI, AIC, and BIC. Superior fit of a bifactor model suggests shared variance across domains not captured by the pure RDoC structure.
- Validation: Apply the best-fitting model to held-out tfMRI data and to coordinate-based meta-analytic data from repositories like Neurosynth.
Table 2: Fit Indices for Competing Neuroimaging Validation Models (Adapted from [90])
| Model Type | Robust RMSEA | Robust CFI | Robust TLI | AIC | BIC | Interpretation |
|---|---|---|---|---|---|---|
| RDoC-Specific Factors | Higher | Lower | Lower | Higher | Higher | Poorer fit to neural data. |
| RDoC-Bifactor | Improved | Improved | Improved | Lower | Lower | Adding a general factor improves fit. |
| Data-Driven Bifactor | Lowest | Highest | Highest | Lowest | Lowest | Best fit, suggests revision to RDoC domains. |
Key Findings: The data-driven bifactor model demonstrated the best fit [90]. Results indicated:
- Domain Overlap: Significant shared variance (general factor) across tasks, suggesting common brain networks.
- Need for Splitting: Cognitive Systems and Negative Valence Systems domains showed loadings spread across multiple data-driven factors, indicating they may be too broad and require subdivision.
- Underrepresentation: The Arousal and Regulatory Systems domain was underrepresented in available tfMRI maps, pointing to a research gap.
Diagram 2: fMRI Data-Driven RDoC Validation Workflow (79 characters)
Behavioral & Clinical Validation
Behavioral validation establishes that RDoC constructs are measurable, variable across individuals, and predictive of functional impairment or treatment response. Psychotherapy research provides a key testing ground.
Protocol: RDoC-Guided Systematic Review of Intervention Effects [91].
- Framework Definition: Use the RDoC matrix as an a priori coding framework.
- Systematic Search: Conduct literature searches (e.g., PubMed, PsycINFO) for studies on an intervention (e.g., psilocybin, cognitive behavioral therapy) and specified mental health outcomes.
- Data Extraction & Coding: Extract outcome measures and code them to the most appropriate RDoC domain and construct (e.g., "changes in amygdala reactivity" -> Negative Valence Systems / Acute Threat).
- Dashboard Synthesis: Organize findings into a dashboard table, noting the direction of effect (beneficial, null, adverse) for each construct.
- Evidence Synthesis: Identify which domains are most/least affected, and if effects are transdiagnostic.
Key Evidence from Psilocybin Review [91]:
- Positive Valence & Social Processes: Strong evidence for short- and long-term beneficial effects.
- Negative Valence: Mixed effects on "fear," but evidence for reduced "sustained threat" long-term.
- Cognitive Systems: Predominantly reports of short-term dyscognitive effects.
- Transdiagnostic Potential: Effects were not confined to any single DSM diagnosis.
Protocol: Psychotherapy Process Research from an RDoC Perspective [46].
- Idiographic Assessment: Use RDoC-aligned measures (behavioral tasks, ecological momentary assessment, physiology) to create a patient-specific profile of strengths and deficits across constructs.
- Mechanism-Targeted Intervention: Apply intervention techniques (e.g., reappraisal, exposure) hypothesized to modulate specific constructs (e.g., reward responsiveness, acute threat).
- Longitudinal Tracking: Repeatedly measure the targeted constructs and broader functional outcomes over time.
- Causal Inference: Use time-series or experimental designs to test if changes in the RDoC construct mediate subsequent clinical improvement.
Integrating RDoC and AOP: A Unified Validation Workflow
For drug development professionals, integrating RDoC and AOP creates a powerful pipeline for target identification and validation. The AOP wiki's structured format for documenting KEs and KERs can be adapted for psychiatric neuroscience [21] [35].
Diagram 3: Integrated RDoC-AOP Development Workflow (76 characters)
Application Example: Developing an AOP for Anhedonia.
- AO: Major Depressive Episode (with prominent anhedonia).
- Candidate KEs (RDoC Constructs): Blunted Reward Prediction Error (Positive Valence) -> Reduced Motivation (Positive Valence) -> Social Withdrawal (Social Processes).
- WoE Assembly:
- Genetic/Molecular: Document associations with dopaminergic, opioid signaling genes [16].
- Circuit: Cite fMRI evidence of attenuated ventral striatum and prefrontal cortex activity during reward tasks.
- Behavioral: Reference task-based measures (probabilistic reward task) and clinical scales (TEPS) [16] [91].
- Essentiality Test: Design a trial where a therapeutic agent (e.g., a novel pharmacokinetic modulator) specifically targets the reward prediction error circuit. Demonstrate that changes in this circuit mediate improvement in anhedonia scores.
The Scientist's Toolkit: Essential Research Reagents & Materials
Table 3: Key Reagents and Resources for RDoC Construct Validation
| Category | Item/Resource | Function in Validation | Example / Source |
|---|---|---|---|
| Genetic Analysis | GWAS/PGx Cohorts | To identify genetic variants associated with quantitative RDoC phenotypes. | UK Biobank, Psychiatric Genomics Consortium. |
| Circuit Mapping | Task-based fMRI Paradigms | To elicit and measure brain activity linked to specific constructs (e.g., fear conditioning, monetary incentive delay). | RDoC matrix lists paradigms per construct [16]. |
| Physiological Assay | Psychophysiological Recording (EDA, HR, EEG/ERP) | To provide objective, continuous measures of arousal, threat response, and cognitive processing. | Error-Related Negativity (ERN) for threat [16]. |
| Behavioral Phenotyping | Computational Cognitive Models | To extract latent construct parameters (e.g., learning rate, prediction error) from behavioral task data. | Drifting Double Bandit task for reward learning [16]. |
| Self-Report | Dimensional Questionnaires | To assess subjective experience related to constructs across a continuum. | TEPS (reward), Fear Survey Schedule (threat) [16]. |
| Data Integration | AOP-Wiki / AOP-KB | To structure and deposit validated RDoC-AOP knowledge in a FAIR (Findable, Accessible, Interoperable, Reusable) format [21] [35]. | https://aopwiki.org |
| Validation Software | Latent Variable Modeling Packages (e.g., in R, Mplus) | To test factor structures and bifactor models of multi-modal data [90]. | lavaan package in R. |
Validating RDoC constructs is an iterative, multi-level process that benefits from the structured, causal logic of the AOP framework. Current evidence, particularly from data-driven neuroimaging, supports the utility of the RDoC approach but also suggests specific revisions, such as splitting broad domains and filling gaps in arousal research [90]. Future work must prioritize:
- Longitudinal Studies: Tracking RDoC measures over time to establish their predictive validity for disorder onset and course.
- Perturbation Studies: Using targeted interventions (pharmacological, neuromodulatory, psychotherapeutic) to rigorously test the essentiality of proposed constructs.
- AOP Network Development: Formally developing neuropsychiatric AOPs within the AOP-KB, linking validated RDoC constructs into causal pathways [35]. This will provide a shared, evolving knowledge base to accelerate the discovery of mechanistically grounded biomarkers and therapeutic targets for mental disorders.
Assessing the Predictive Power of Protein Domain Classification for Drug Discovery (e.g., Kinases, GPCRs)
Within the structured framework of Adverse Outcome Pathway (AOP) research, which seeks to delineate predictable sequences from molecular initiating events to adverse organism-level outcomes, the classification of protein domains serves as a critical taxonomic and predictive tool. This guide posits that the intrinsic structural and functional architecture of protein domains—autonomous evolutionary units that define a protein's mechanistic capabilities—provides a powerful, generalizable framework for predicting druggability, optimizing lead compounds, and anticipating mechanisms of resistance. The predictive power of domain classification stems from the principle that shared structural folds confer shared biochemical functions and regulatory mechanisms, which can be systematically exploited in drug discovery [92].
Two protein domain families exemplify this paradigm: the eukaryotic protein kinase (PK) domain and the G protein-coupled receptor (GPCR) seven-transmembrane (7TM) domain. Protein kinases, which catalyze the transfer of a phosphate group from ATP to substrate proteins, share a conserved catalytic core that has yielded one of the most successful classes of targeted therapeutics [92] [93]. GPCRs, the largest family of human membrane receptors, share a canonical 7TM α-helical bundle that transduces diverse extracellular signals, making them the target of approximately 34-35% of FDA-approved drugs [94] [95]. The classification of a novel target into one of these well-characterized domain families immediately generates testable hypotheses about viable drug-binding sites (e.g., the ATP-binding pocket in kinases, orthosteric or allosteric pockets in GPCRs), activation/inactivation mechanisms, and potential off-target effects based on domain similarity.
This technical guide provides an in-depth analysis of the structural foundations of these domains, details experimental and computational protocols for leveraging domain classification in discovery pipelines, and presents a framework for assessing the predictive power of this approach within the mechanistic context of AOP-driven research.
Structural Foundations: Domain Architecture as a Blueprint for Druggability
The Eukaryotic Protein Kinase Domain: A Conserved Regulatory Switch
The protein kinase domain is a bilobed structure (N-lobe and C-lobe) with a deep cleft that binds ATP and a protein substrate [92]. Key regulatory elements include:
- Activation Loop (A-loop): Phosphorylation typically stabilizes an active conformation.
- αC-helix: Its "in" or "out" position is a hallmark of active or inactive states.
- Hydrophobic Spines: The regulatory (R-spine) and catalytic (C-spine) are networks of residues that must be properly assembled for activity [92].
This conserved architecture creates well-defined pockets. Most kinase inhibitors target the ATP-binding site, exploiting subtle variations in amino acid residues and pocket geometry to achieve selectivity. More recently, allosteric pockets outside the ATP site, often formed in inactive kinase conformations, are targeted for higher selectivity and to overcome resistance [92] [96]. Domain classification immediately directs the medicinal chemist to these known pocket typologies.
The GPCR Seven-Transmembrane Domain: A Dynamic Signaling Module
GPCRs share a common 7TM fold but exhibit significant sequence and structural diversity across classes (A-F) [95]. The domain's function is defined by its ability to adopt multiple conformational states. Key structural features include:
- Orthosteric Binding Site: Often located within the extracellular half of the TM bundle for endogenous ligands.
- Allosteric Binding Sites: Found in diverse locations (extracellular vestibule, intracellular surface, between TM helices), offering opportunities for subtype-selective modulation [94] [95].
- Conserved Micro-switches (e.g., DRY, NPxxY): Residue networks that change conformation upon activation to facilitate coupling to intracellular transducers like G proteins or arrestins [95].
Classification of a GPCR into a specific family (e.g., Class A Rhodopsin-like) predicts the general location of the orthosteric site and the nature of its activation mechanism, guiding screening and design strategies toward orthosteric agonists/antagonists, allosteric modulators, or bitopic ligands that span both sites [94].
Table 1: Comparative Structural & Druggability Features of Kinase and GPCR Domains
| Feature | Protein Kinase Domain | GPCR 7TM Domain |
|---|---|---|
| Core Structural Fold | Bilobed catalytic core (N-lobe, C-lobe) [92] | Seven transmembrane α-helical bundle [94] [95] |
| Primary Natural Ligand | ATP/Mg²⁺ (within the cleft) [92] | Diverse (photons, amines, peptides, lipids) [94] |
| Key Regulatory Elements | Activation loop, αC-helix, hydrophobic spines [92] | Intracellular loops (ICLs), conserved micro-switches (DRY, NPxxY) [95] |
| Canonical Drug-Binding Site | ATP-binding cleft (deep hydrophobic pocket) [92] | Orthosteric site (overlaps endogenous ligand pocket) [94] |
| Major Selectivity Strategy | Exploit unique gatekeeper residues & back/side pockets [92] [96] | Target less-conserved allosteric sites or design bitopic ligands [94] [95] |
| Common Resistance Mechanism | Gatekeeper mutations, activation loop mutations [92] | Point mutations altering binding sites or constitutive activation [97] |
Predictive Frameworks: From Domain Classification to Discovery Hypotheses
Domain classification enables predictive models in drug discovery. For kinases, identifying the activation state targeted (DFG-in/out, αC-helix in/out) can predict inhibitor selectivity profiles. For GPCRs, classifying the receptor's predominant G-protein coupling (Gs, Gi/o, Gq/11) predicts downstream signaling effects and potential biased agonism outcomes [94] [95].
A powerful application is predicting polypharmacology and off-target toxicity. A compound designed against a kinase in the CMGC group (e.g., CDK2) may be screened in silico against a panel of other kinases sharing similar ATP-pocket features, predicting potential adverse effects [96] [98]. Similarly, understanding conserved allosteric networks in GPCRs can help design modulators that avoid related receptor subtypes [94].
Table 2: Predictive Insights from Domain Classification for Key Drug Discovery Parameters
| Discovery Parameter | Predictive Insight from Kinase Domain Classification | Predictive Insight from GPCR Domain Classification |
|---|---|---|
| Druggability & Hit ID | High; ATP-site is deep, hydrophobic, and conserved. High-throughput screening with ATP-competitive libraries is standard [92] [96]. | Variable; orthosteric sites may be polar or shallow. Allosteric sites offer alternatives. Screening often requires functional or binding assays [94]. |
| Lead Optimization Vector | Optimize for interactions with hinge region, gatekeeper residue, and hydrophobic back/side pockets [92]. | Optimize for subtype-specific allosteric pocket contacts or bitopic engagement to improve selectivity [94] [95]. |
| Selectivity Challenge | High sequence/structure conservation in ATP site across >500 human kinases [92] [93]. | High conservation of orthosteric sites within receptor subfamilies (e.g., amine-binding in Class A) [94]. |
| Primary Selectivity Strategy | Target inactive conformations or allosteric sites; use covalent warheads for specific cysteines [92] [96]. | Target extracellular or intracellular allosteric sites with lower sequence conservation [94] [95]. |
| Resistance Prediction | Anticipate mutations at gatekeeper residues or in the A-loop that enlarge the ATP pocket [92]. | Anticipate mutations that constitutively activate the receptor or alter the drug-binding pocket [97]. |
Experimental Protocols for Domain-Centric Discovery
Protocol 1: Structural Characterization of Domain-Ligand Complexes
Objective: Determine high-resolution structure of target domain bound to lead compound to guide optimization.
- For Soluble Domains (e.g., Kinase Catalytic Domain):
- Protein Expression & Purification: Express recombinant human kinase domain in insect or mammalian cells. Purify via affinity and size-exclusion chromatography [92].
- Crystallization: Use vapor diffusion or lipid cubic phase methods. Co-crystallize with inhibitor.
- Data Collection & Refinement: Collect X-ray diffraction data at a synchrotron. Solve structure by molecular replacement using a homologous kinase domain. Refine to high resolution (<2.5 Å) [92].
- For Membrane Protein Domains (e.g., GPCR 7TM Domain):
- Protein Engineering: Stabilize receptor using fusion proteins (e.g., BRIL), thermostabilizing mutations, or antibody fragments (e.g., nanobodies) [94] [95].
- Structure Determination: Employ single-particle cryo-electron microscopy (cryo-EM) for receptor-signaling complexes (e.g., GPCR-G protein). For small molecules, X-ray crystallography of stabilized constructs is used [94] [95].
- Analysis: Map electron density for the ligand, identify key binding interactions (hydrogen bonds, hydrophobic contacts, salt bridges), and analyze conformational changes relative to apo or antagonist-bound structures.
Protocol 2: Assessing Binding Affinity and Selectivity Across a Domain Family
Objective: Quantify compound affinity for the intended target and related domains to establish selectivity profile.
- Assay Selection: Use a Fluorescent Thermal Shift Assay (FTSA) for initial, medium-throughput affinity screening across multiple purified protein domains [99]. This measures the stabilization of protein unfolding (Tm) in the presence of ligand.
- Experimental Setup: Prepare samples containing a fixed concentration of each purified domain (e.g., 5-10 µM), a range of ligand concentrations (0-400 µM), and a fluorescent dye (e.g., SYPRO Orange). Use a real-time PCR instrument to heat samples from 25°C to 99°C at 1°C/min while monitoring fluorescence [99].
- Data Analysis: Fit melting curves to determine Tm at each ligand concentration. Plot ΔTm vs. ligand concentration to derive apparent binding constants (Kd) for each domain [99].
- Selectivity Index: Calculate the ratio of Kd for the closest homologous off-target to Kd for the primary target. A value >100 is often indicative of high selectivity.
Protocol 3: Computational Screening Leveraging Domain Classification
Objective: Identify novel chemotypes by screening virtual compound libraries against a structural model of the target domain.
- Model Preparation: If an experimental structure is unavailable, build a homology model using a high-resolution structure of a closely related domain as a template (e.g., >50% sequence identity).
- Pocket Definition: Define the binding pocket coordinates (orthosteric or allosteric) based on the canonical site for the domain family.
- Virtual Screening: Dock millions of commercially available compounds from libraries like ZINC into the defined pocket using software such as AutoDock Vina or Glide.
- Hit Prioritization: Rank compounds by docking score. Apply filters for drug-likeness (Lipinski's Rule of Five), chemical novelty, and structural diversity. Visually inspect top-scoring poses for sensible binding interactions.
- Generative AI & Machine Learning: Employ advanced models like CORDIAL (COnvolutional Representation of Distance-dependent Interactions with Attention Learning), which focuses on generalizable physicochemical interaction principles rather than specific chemical structures, to improve hit prediction for novel domain targets [100].
Diagram 1: Domain-Informed Drug Discovery Workflow (99 chars)
The Scientist's Toolkit: Essential Reagent Solutions
Table 3: Key Research Reagent Solutions for Domain-Centric Studies
| Reagent/Category | Function in Domain-Centric Research | Example Application |
|---|---|---|
| Stabilized Protein Constructs | Engineering for structural studies (crystallography, Cryo-EM). | GPCRs fused with BRIL or T4 lysozyme; kinase domains with stabilizing mutations [94] [95]. |
| Fluorescent Thermal Shift Dyes | Label-free measurement of protein thermal stability for affinity screening. | SYPRO Orange or ANS dye used in FTSA to measure ligand binding across a domain family [99]. |
| Cryo-EM Grids & Detectors | High-resolution imaging of large, flexible domain complexes. | Determining structures of GPCR-G protein or GPCR-arrestin complexes in near-native states [94] [95]. |
| Pathway-Selective Cell Lines | Assaying functional outcomes of domain modulation (e.g., biased signaling). | Cell lines reporting on specific GPCR pathways (cAMP, β-arrestin recruitment) for compound profiling [94]. |
| Kinase Profiling Services | High-throughput assessment of selectivity across the kinome. | Testing lead compounds against panels of hundreds of purified kinase domains to define selectivity profiles [96]. |
| Domain-Focused Compound Libraries | Libraries enriched for chemotypes known to bind specific domain folds. | ATP-site-focused libraries for kinase screening; fragment libraries for GPCR allosteric site exploration [96] [98]. |
Case Studies in Predictive Power
Case Study 1: Exploiting the "Selective Pocket" in Carbonic Anhydrase Isoforms
While not a kinase or GPCR, the carbonic anhydrase (CA) family perfectly illustrates the "lock-and-key" predictive power of domain classification. Human CA isoforms share a highly conserved catalytic domain with a central zinc ion [99]. The "conserved pocket" near the zinc is nearly identical, but a "selective pocket" near the entrance varies. Researchers designed benzenesulfonamide inhibitors with systematically enlarged substituents. X-ray structures showed that high-affinity, isoform-selective inhibitors (e.g., for cancer-associated CA IX) perfectly filled the unique contours of the selective pocket, while being sterically occluded from off-target isoforms like CA II [99]. This demonstrates that domain classification, followed by precise mapping of sub-pockets, can directly predict and enable the rational design of selective agents.
Case Study 2: Predicting and Overcoming Kinase Resistance Mutations
The classification of EGFR as a receptor tyrosine kinase (TK) domain predicted its mechanism of oncogenic activation and susceptibility to ATP-competitive inhibitors like gefitinib. It also predicted the primary mechanism of resistance: mutations in the ATP-pocket "gatekeeper" residue (T790M) that sterically hinder drug binding [92]. This domain knowledge directly led to the design of third-generation inhibitors (e.g., osimertinib) that form a covalent bond with a unique cysteine (C797) present in the kinase domain, effectively overcoming the T790M resistance. This showcases how domain-specific architecture predicts both the therapeutic vulnerability and the evolutionary path to resistance, enabling proactive drug design.
Case Study 3: Allosteric Modulation Predicted by GPCR Domain Dynamics
The classification of the metabotropic glutamate receptor 5 (mGlu5) as a Class C GPCR predicted its activation via closure of a large extracellular Venus flytrap domain (VFTD), distinct from Class A receptors. This knowledge directed discovery efforts away from the conserved 7TM orthosteric site and towards allosteric modulators that bind within the 7TM bundle. Negative allosteric modulators (NAMs) like mavoglurant bind in a pocket formed by transmembrane helices, stabilizing an inactive state and providing unparalleled subtype selectivity over other glutamate receptors [94] [95]. This underscores how domain classification at the family level (Class C vs. Class A) predicts viable and superior drugging strategies.
Diagram 2: GPCR Domain-Mediated Signaling Pathways (98 chars)
The systematic classification of protein domains provides a robust, predictive scaffold for drug discovery. By mapping molecular initiating events in an AOP to specific protein domains (e.g., kinase X activation, GPCR Y antagonism), researchers can prioritize well-characterized, druggable domains for intervention and predict downstream key events based on domain function.
The future of this field lies in deeper integration with artificial intelligence and machine learning. Models like CORDIAL, which learn general principles of molecular interactions rather than memorizing specific structures, promise to extend predictive power to novel or less-characterized domain folds [100]. Furthermore, the integration of domain-classified chemoproteomic and phenotypic screening data will refine predictions of polypharmacology and system-level effects.
Ultimately, treating protein domains as fundamental taxonomic units within a mechanistic AOP framework transforms drug discovery from a target-centric to a domain-centric endeavor. This shift enhances predictability, enables rational design of selective agents, and provides a structured knowledge base for understanding and overcoming therapeutic resistance.
The discovery of novel therapeutic targets is undergoing a paradigm shift, moving from siloed investigations to the integrative analysis of biological data across multiple scales. This guide details a methodology for synergizing two critical but often disconnected data domains: taxonomic lineage information (the evolutionary position of an organism) and protein structural data (the three-dimensional conformation of biological macromolecules). This integration is framed within the Adverse Outcome Pathway (AOP) framework, a knowledge-assembly tool endorsed by the Organisation for Economic Co-operation and Development (OECD) for organizing mechanistic toxicological knowledge from a molecular initiating event to an adverse outcome at the organism or population level [101].
The core thesis is that evolutionary conservation, inferred from taxonomy, can prioritize protein targets whose structural perturbation is linked to adverse outcomes defined in AOP networks. By applying artificial intelligence (AI) and bioinformatics tools [102], researchers can traverse biological scales—from the broad patterns of evolution to the atomic details of protein-ligand interactions—to identify and validate novel targets with high mechanistic relevance to disease pathways.
Foundational Concepts and Quantitative Landscape
The AOP Framework as an Organizing Principle
An AOP is a structured sequence that begins with a Molecular Initiating Event (MIE), typically a specific interaction between a stressor and a biomolecule, and progresses through a series of essential, measurable Key Events (KEs), culminating in an Adverse Outcome (AO) relevant for risk assessment [101]. For drug discovery, this framework is inverted: a disease-relevant AO is identified, and the causal chain is deconstructed to identify potential MIEs—such as the binding of a drug to a specific protein target—that could modulate the pathway for therapeutic benefit.
Table 1: Core AOP Terminology and Relevance to Target Discovery [101]
| Term | Abbreviation | Definition | Role in Target Discovery |
|---|---|---|---|
| Molecular Initiating Event | MIE | The initial point of chemical/stressor interaction with a biomolecule that starts the AOP. | Identifies the most upstream, drug-gable target (e.g., a protein, receptor). |
| Key Event | KE | A measurable biological change essential for progression along the AOP. | Provides intermediate biomarkers for testing target engagement and pathway modulation. |
| Key Event Relationship | KER | A scientifically supported, causal link between an upstream and downstream KE. | Informs the biological plausibility of the target and predicts potential downstream effects. |
| Adverse Outcome | AO | An endpoint of regulatory or disease significance. | Defines the clinical or pathological phenotype the therapy aims to prevent or ameliorate. |
A recent mapping of the AOP-Wiki database reveals thematic concentrations and gaps. As of 2023, analysis of 403 AOPs showed a strong focus on certain disease areas [35].
Table 2: Mapping of Adverse Outcomes in the AOP-Wiki Database (Representative Analysis) [35]
| Disease/Category Group | Relative Representation | Implication for Target Discovery |
|---|---|---|
| Diseases of the genitourinary system | High | Well-supported AOPs may offer validated KEs for targets in renal or reproductive toxicity/therapy. |
| Neoplasms (Cancers) | High | Rich source of mechanistic pathways for oncology target identification. |
| Developmental anomalies | High | Informs targets for developmental disorders and prenatal toxicity. |
| Immunotoxicity | Moderate (Priority Area) | Active area (e.g., EU PARC project); identifies targets for immune dysregulation. |
| Neurotoxicity / Developmental Neurotoxicity | Moderate (Priority Area) | Highlights targets in neuronal function and development. |
| Endocrine & Metabolic Disruption | Moderate (Priority Area) | Source for targets in diabetes, obesity, and endocrine disorders. |
The Role of Taxonomic Data and AI in Species Delimitation
Accurate species classification is foundational. Traditional morphology-based taxonomy is increasingly integrated with genomic data in "integrative taxonomy." AI and machine learning (ML) are now critical for analyzing complex, multi-dimensional datasets to resolve taxonomically complex groups affected by hybridization or asexuality [103]. Precise species delimitation ensures correct attribution of genomic and functional data, which is vital for understanding evolutionary conservation.
AI-Driven Protein Structure Prediction and Analysis
The field has been revolutionized by deep learning tools like AlphaFold, which achieve near-atomic accuracy (e.g., a median backbone accuracy of 0.96 Å on CASP14 targets) [102]. Accurate in silico protein models enable:
- Conservation Analysis: Mapping of evolutionarily conserved residues onto 3D structures to identify critical functional or structural regions.
- Binding Site Prediction: Identification of pockets and cavities likely to bind ligands.
- Disease Variant Mapping: Understanding how genetic variations alter protein structure and function.
Integrated Methodology: A Technical Guide
The following workflow outlines a protocol for integrating cross-scale data for target discovery, contextualized within the AOP framework.
Graphviz workflow diagram: AOP-guided, cross-scale target discovery workflow.
Phase 1: AOP-Guided Scoping and Target Identification
- Select an AOP: Navigate the AOP-Wiki to identify a pathway where the AO aligns with a disease of interest (e.g., liver fibrosis, neurodegenerative disease) [101] [35].
- Deconstruct the Pathway: Trace the pathway upstream from the AO through the KEs to the MIE. The protein or biomolecule involved in the MIE is the primary candidate target. For example, an MIE of "Inhibition of the enzyme IDO1" directly nominates the IDO1 protein as a target [104].
- Assess Confidence: Evaluate the Weight of Evidence (WoE) for the AOP and the essentiality of the KEs within the AOP-Wiki entry. High-confidence pathways provide stronger mechanistic justification for target pursuit [101].
Phase 2: Cross-Scale Data Integration and Analysis
- Retrieve Taxonomic and Sequence Data: For the MIE protein (e.g., human IDO1), retrieve its amino acid sequence and use orthology prediction tools (e.g., Ensembl Compara, OrthoDB) to identify orthologs across a wide taxonomic range relevant to the AOP's domain of applicability [105].
- Perform Phylogenetic and Conservation Analysis:
- Perform a multiple sequence alignment of orthologous proteins.
- Construct a phylogenetic tree to visualize evolutionary relationships.
- Calculate evolutionary conservation scores (e.g., using ConSurf) for each amino acid position. Highly conserved residues are often critical for function or structure.
- Integrate Protein Structure:
- Acquire a 3D Structure: Retrieve an experimental structure from the PDB or generate a high-confidence predicted model using AlphaFold2 or RoseTTAFold [102].
- Map Conservation onto Structure: Use visualization software (e.g., PyMOL, ChimeraX) to color-code the protein structure by conservation score. This creates a functional-evolutionary map, highlighting conserved active sites, binding interfaces, or allosteric networks.
Phase 3: In Silico Target Validation and Ligand Discovery
- Binding Site Analysis & Prioritization: Run binding pocket detection algorithms (e.g., fpocket, DeepSite) on the protein structure. Prioritize pockets that are both druggable (with suitable volume and chemistry) and evolutionarily conserved, suggesting fundamental functional importance.
- Virtual Screening (VS):
- Prepare a library of small molecule compounds.
- Dock each compound into the prioritized binding pocket using molecular docking software (e.g., AutoDock Vina, Glide).
- Rank compounds based on predicted binding affinity (docking score) and complementary interaction with conserved residues.
- AI-Enhanced Compound Design: Utilize generative AI models (Variational Autoencoders, Generative Adversarial Networks) to design novel chemical entities optimized for the specific geometry and chemistry of the conserved binding pocket [104].
Experimental Validation Protocols
The following protocol details a novel assay method suitable for validating target engagement resulting from the integrated discovery process.
The SDR assay is a universal, label-free method that detects ligand binding by measuring changes in the natural vibrations (dynamics) of a target protein, reported via a split NanoLuc luciferase sensor.
I. Principle: Ligand binding alters a protein's conformational dynamics. This change modulates the complementation efficiency of a split NanoLuc luciferase enzyme fused to the target protein, resulting in a measurable change in luminescent output.
II. Reagents and Materials:
- Target Protein: Purified protein of interest (requires significantly less protein than standard assays) [106].
- SDR Construct: Expression vector for the target protein fused to a small fragment (e.g., SmBiT) of the split NanoLuc luciferase.
- Complementary Fragment: The large fragment (e.g., LgBiT) of the split NanoLuc.
- Ligand/Compound Library: Compounds for testing (e.g., from virtual screening).
- Luciferase Substrate: Furimazine.
- Plate Reader: Capable of measuring luminescence.
III. Procedure:
- Expression & Purification: Express and purify the target protein-SmBiT fusion construct.
- Assay Assembly: In a white 384-well plate, mix:
- The purified fusion protein.
- The complementary LgBiT fragment.
- The test compound at desired concentrations (include DMSO-only controls).
- Incubation: Incubate the plate to allow for ligand binding and NanoLuc complementation (typically 10-30 minutes at room temperature).
- Signal Detection: Add the furimazine substrate and immediately measure luminescence intensity with a plate reader.
- Data Analysis: Normalize luminescence to controls. A significant increase or decrease in signal indicates compound binding. The assay can detect binders at both active and allosteric sites without requiring knowledge of protein function [106].
Table 3: The Scientist's Toolkit: Key Reagents for Integrated Discovery
| Research Reagent / Tool | Category | Function in the Workflow | Example/Source |
|---|---|---|---|
| AOP-Wiki Database | Knowledge Base | Provides structured, mechanistic pathways to identify and justify potential protein targets linked to adverse outcomes [101] [35]. | aopwiki.org |
| AlphaFold2 / RoseTTAFold | AI Software | Predicts highly accurate 3D protein structures from amino acid sequence, enabling structural analysis in the absence of experimental data [102]. | DeepMind, Baker Lab |
| ConSurf Server | Bioinformatics Tool | Calculates evolutionary conservation scores for amino acid positions in a protein and maps them onto a 3D structure. | consurf.tau.ac.il |
| SDR Assay Components | Wet-Lab Assay | A universal biochemical assay to experimentally validate ligand binding to a target protein by detecting changes in protein dynamics [106]. | NCATS Protocol [106] |
| Split NanoLuc Luciferase | Reporter System | The sensor protein used in the SDR assay; its luminescent output changes upon modulation of the fused target protein's dynamics [106]. | Promega NanoBiT |
| Taxonomic Classification AI | AI Model | Machine learning models that improve species delimitation and genomic data attribution, ensuring accurate ortholog retrieval [103] [105]. | Various ML classifiers [105] |
Contextualization within AOP Networks and Future Outlook
The ultimate power of this approach lies in embedding the discovered target within an AOP network. A single protein target (MIE) may participate in multiple AOPs leading to different AOs. Understanding this network predicts potential on-target side effects and informs patient stratification [35].
Graphviz diagram: Placing a discovered target within an AOP network context.
Future Directions:
- AI for AOP Development: Tools like AOP-helpFinder use NLP to automatically mine literature for potential KE relationships, accelerating AOP assembly and expanding the network for target identification [35].
- Quantitative AOPs (qAOPs): Integrating kinetic and dynamic data into AOPs will allow predictive modeling of drug effects across the pathway.
- Digital Twins: Patient-specific models integrating multi-omics data with AOP networks could predict individual therapeutic responses to a modulator of the discovered target [104].
The integration of taxonomic lineage data with high-fidelity protein structure prediction, guided by the mechanistic framework of AOPs, creates a powerful, hypothesis-driven engine for novel target discovery. This cross-scale approach leverages evolutionary pressure as a filter for functional importance and AOP knowledge to ensure therapeutic relevance. Coupled with emerging experimental techniques like the SDR assay and advanced AI for compound design, this pipeline represents a robust, scalable, and rational strategy for advancing next-generation therapeutics.
The Adverse Outcome Pathway (AOP) framework has emerged as a critical paradigm for organizing mechanistic knowledge in toxicology and drug development. An AOP describes a sequence of measurable biological events, from a Molecular Initiating Event (MIE)—often the interaction of a stressor with a protein target—through intermediate Key Events (KEs), culminating in an Adverse Outcome (AO) relevant to risk assessment [27]. The utility of AOPs hinges on the precise annotation of these events, particularly at the molecular and cellular levels, where detailed protein structure and function data are paramount.
A persistent challenge in AOP development has been the "structural annotation gap" for many proteins implicated in toxicity pathways. Traditional experimental methods like X-ray crystallography and cryo-EM, while powerful, are resource-intensive and cannot keep pace with the vast universe of proteins and their potential modified states [107]. This gap limits the resolution at which MIEs can be defined and hampers cross-species extrapolation, a cornerstone of translational toxicology.
The advent of artificial intelligence (AI)-driven protein structure prediction, epitomized by AlphaFold, is poised to fundamentally bridge this gap. By providing accurate, atomic-level models for nearly any protein from its sequence, AlphaFold and related tools are transitioning structural biology from a predominantly experimental, hypothesis-driven discipline to a discovery-driven science [107]. This whitepaper details how this technological revolution is expanding structural domain annotations, enriching the AOP-Wiki knowledge base, and creating new, efficient workflows for researchers and drug development professionals. The integration of predicted structures offers a path to more quantitatively defined AOPs, enabling stronger links between in silico predictions, in vitro assays, and in vivo outcomes.
Foundational Technologies: AlphaFold's Evolution and the Structural Data Ecosystem
The AlphaFold Revolution: From Sequences to Complexes
The development of AlphaFold represents a paradigm shift in computational biology. Its journey spans key iterations:
- AlphaFold (Initial): Demonstrated the potential of deep learning for structure prediction.
- AlphaFold2: Introduced an end-to-end deep learning architecture that achieved atomic-level accuracy, effectively solving the long-standing protein folding problem as validated in the CASP14 competition [108] [109].
- AlphaFold3: Extended predictive capabilities beyond single polypeptide chains to model biomolecular complexes, including interactions with ligands, nucleic acids, and ions [108] [110].
A core output of AlphaFold2 is the predicted Local Distance Difference Test (pLDDT) score, a per-residue confidence metric ranging from 0-100. This score is crucial for interpreting predictions, where regions with pLDDT > 90 are considered highly reliable, while scores < 50 indicate disordered regions [109]. The public AlphaFold Protein Structure Database, a collaboration between Google DeepMind and EMBL-EBI, provides open access to over 200 million predicted structures, including complete proteomes for humans and 47 other key organisms [109].
Complementary and Validating Methodologies
AI predictions do not operate in a vacuum but are part of an integrative structural biology ecosystem.
- Cryo-Electron Microscopy (Cryo-EM): This experimental technique excels at solving structures of large, flexible complexes and membrane proteins at near-atomic resolution. It serves as a critical validation tool for AI predictions and provides empirical data for modeling conformational dynamics [107].
- Specialized Structural Databases: Resources like the Protein Data Bank (PDB) house experimentally determined structures. Newer databases like RepeatsDB are dedicated to specific protein classes, such as structured tandem repeat proteins (STRPs), and now integrate both experimental and AlphaFold-predicted models to provide comprehensive annotations [111].
Table 1: Core Structural Biology Resources and Databases
| Resource Name | Primary Content | Key Metric (as of 2025) | Role in Domain Annotation |
|---|---|---|---|
| AlphaFold DB [109] | AI-predicted protein structures | >200 million entries | Provides foundational 3D models for uncharacterized proteins. |
| Protein Data Bank (PDB) | Experimentally-determined structures | ~200,000 entries | Gold-standard validation and source of high-confidence templates. |
| RepeatsDB [111] | Annotated Structured Tandem Repeats (STRPs) | 34,319 unique sequences annotated | Specialized resource for detecting and classifying repeat domain architectures. |
| STRPsearch [111] | Algorithm for detecting STRPs | Scans 1000s of structures rapidly | Enables high-throughput annotation of repeat domains in predicted structures. |
Expanding the Structural Landscape: Domain Annotation at Scale
AI-predicted structures are dramatically accelerating the identification and characterization of functional protein domains, moving beyond canonical folds to illuminate darker areas of the proteome.
Enabling High-Throughput Domain Discovery
Traditional domain annotation relied on sequence homology and limited experimental structures. AlphaFold's massive, uniform-quality dataset enables systematic, structure-based searches across entire proteomes. Tools like STRPsearch leverage fast structural alignment algorithms (e.g., FoldSeek) to detect repeating structural units in proteins [111]. Applied to the AlphaFold database, this has led to a fifteenfold increase in the annotation of structured tandem repeat proteins in RepeatsDB, from a manually curated set to over 34,000 unique protein sequences [111]. This demonstrates the power of AI to scale domain annotation from boutique curation to industrial-scale discovery.
Illuminating Poorly Characterized Protein Regions
Many proteins contain domains or regions of low sequence complexity that are difficult to study experimentally. AlphaFold models provide testable hypotheses for their structure. For instance, the C-terminal domain (CTD) of Cas9 exhibits high variability across homologs. Structural analysis of AlphaFold models, complemented by experimental validation, can identify flexible, non-conserved segments (e.g., residues 1242–1263 in S. pyogenes Cas9) that are dispensable for function and can be engineered as "plug-and-play" sites for domain insertion or replacement [112]. This precise structural knowledge transforms vague "linker" or "disordered" regions into defined engineering targets.
Informing AOP Development: From Molecular Event to Structural Context
Within the AOP framework, AlphaFold directly informs the molecular initiating event (MIE). A precise 3D model of a protein target allows for:
- Defining the Molecular Initiating Event (MIE): Visualizing the exact binding pocket where a stressor (e.g., a chemical) interacts, moving from a generic "binding to Protein X" to a stereospecific description.
- Cross-Species Extrapolation: Comparing the predicted structures of orthologous proteins across species to assess conservation of key residues in binding or active sites. This strengthens the biological plausibility of using data from model organisms in human health risk assessment [27] [28].
- Identifying Novel Key Event Relationships: Structural similarity between disparate proteins, revealed through database searches of predicted models, can suggest shared mechanistic pathways or potential off-target effects, leading to new AOP hypotheses.
Diagram: AlphaFold's role in enriching the AOP framework with structural knowledge.
Implications for Drug Discovery and Development
The expansion of structural domain annotations is having a tangible impact on pharmaceutical R&D, accelerating and refining multiple stages of the pipeline.
Accelerating Target Identification and Validation
AI-expanded structural annotations help de-risk drug targets by providing immediate structural context. Understanding the full domain architecture of a novel target—including allosteric sites and protein-protein interaction interfaces—informs assay design and helps anticipate functional consequences of modulation. This is particularly valuable for target classes historically difficult to characterize, such as membrane proteins and large complexes [107].
Revolutionizing Ligand Discovery and Optimization
The next frontier beyond static structure prediction is accurately modeling biomolecular interactions. While AlphaFold3 predicts binding poses, new models like Boltz-2 are tackling the prediction of binding affinity, achieving speeds thousands of times faster than traditional physics-based simulations [110]. Furthermore, repositories like the Structurally-Augmented IC50 Repository (SAIR) provide millions of computationally folded protein-ligand structures linked to experimental affinity data, creating essential training data for AI models [110]. This enables rapid virtual screening and generative design of novel molecules with desired binding properties.
Table 2: Impact of AI and Expanded Structural Data on Drug Discovery Phases
| R&D Phase | Traditional Challenge | AI/AlphaFold-Enabled Solution | Example Tool/Outcome |
|---|---|---|---|
| Target ID/Validation | Lack of structural information for novel or difficult targets. | Immediate access to predicted 3D models and domain annotations. | Characterizing orphan proteins or splice variants. |
| Hit Identification | High-cost, low-throughput experimental screening. | Ultra-fast virtual screening and binding affinity prediction. | Boltz-2 model predicting affinity in seconds [110]. |
| Lead Optimization | Engineering for selectivity and avoiding off-target effects. | Predicting interactions across protein families to assess polypharmacology risk. | Using structural similarity searches in predicted proteomes. |
| Clinical Trials | High failure rates due to lack of efficacy. | Better patient stratification via structural understanding of genetic variants. | Interpreting variants of uncertain significance (VUS) in drug targets. |
Emerging Trends: AI-Designed Therapeutics and Regulatory Evolution
The field is rapidly progressing from AI-assisted to AI-designed therapeutics. The first generative-AI-designed drug candidate has entered Phase 2 trials, validating the approach [113]. Concurrently, regulatory agencies are establishing frameworks for evaluating AI in submissions. The FDA's 2025 guidance on AI in drug development introduces a risk-based credibility assessment, formalizing AI's role in regulated workflows [113]. This normalization reduces adoption risk and encourages investment.
Experimental and Computational Protocols
Integrating AI predictions into robust research requires specific methodologies. Below are protocols for leveraging expanded annotations in AOP-relevant research.
Protocol for Structural Domain Annotation and AOP Enrichment
Objective: To identify and annotate functional domains in a protein of interest (POI) implicated in a toxicity pathway and integrate this structural knowledge into an AOP framework.
- Sequence Retrieval & Initial Prediction: Obtain the amino acid sequence of the POI from UniProt. Query the AlphaFold DB for its predicted structure. Download the model and analyze the per-residue pLDDT confidence scores [109].
- High-Throughput Domain Scanning: Submit the predicted structure (in PDB format) to specialized annotation servers.
- For repeat domains, use STRPsearch or the RepeatsDB web interface to detect structured tandem repeats [111].
- For general domain annotation, use tools like Pfam or InterPro, which are increasingly integrating AlphaFold predictions.
- Structural Comparison and Functional Site Prediction: Use fast structural alignment tools (e.g., FoldSeek) to search the AlphaFold DB or PDB for proteins with similar fold(s). Manually inspect top hits in molecular viewers to identify conserved active sites, binding grooves, or protein-protein interaction interfaces.
- AOP-Wiki Integration: Within the relevant AOP-Wiki page, use the structured comment fields to link the POI's UniProt ID. In the MIE or KE descriptions, cite the AlphaFold model identifier (e.g., AF-XXXXX-F1) and describe the specific structural feature (e.g., "binding to the predicted hydrophobic pocket formed by beta-strands 2-4"). Upload relevant images of the annotated structure.
Protocol forIn SilicoMolecular Initiating Event (MIE) Characterization
Objective: To characterize the potential interaction between a chemical stressor and a protein target at atomic detail to define an MIE.
- Complex Structure Preparation: Obtain the predicted structure of the target protein (from AlphaFold DB) or a high-quality experimental structure (from the PDB). If using an AlphaFold monomer model of an unliganded protein, consider using a tool like Boltz-1x or AlphaFold3 to generate a more accurate binding pocket conformation or a predicted complex structure [110].
- Molecular Docking: Prepare the 3D structure of the chemical stressor using cheminformatics software. Perform molecular docking into the putative binding site identified in Step 1, using standard software (e.g., AutoDock Vina, Glide). Use the predicted pLDDT to weight the reliability of the docking site; residues with low confidence should be interpreted cautiously.
- Binding Affinity Estimation (Optional but Advised): For top-ranked docking poses, use a fast AI-based affinity predictor like Boltz-2 to estimate the binding energy [110]. This provides a quantitative metric complementary to the docking score.
- Interaction Analysis & MIE Documentation: Analyze the predicted molecular interactions (hydrogen bonds, hydrophobic contacts, etc.). Document this detailed interaction profile as the proposed MIE, explicitly stating it is based on a predicted or modeled complex. This forms a testable hypothesis for subsequent in vitro assay development.
Diagram: Workflow for expanding domain annotations and deriving testable AOP hypotheses.
Table 3: Research Reagent Solutions for AI-Augmented Structural Domain Research
| Tool/Resource Name | Type | Primary Function in Domain Annotation | Access |
|---|---|---|---|
| AlphaFold Protein Structure Database [109] | Database | Primary source for pre-computed, high-accuracy protein structure predictions. | Open Access (Web/API) |
| RepeatsDB & STRPsearch [111] | Database & Algorithm | Specialized detection and classification of structured tandem repeat domains in protein structures. | Open Access |
| FoldSeek [111] | Algorithm | Ultra-fast structural alignment and search, enabling comparison of millions of predicted structures. | Open Source |
| Boltz-2 & SAIR Repository [110] | AI Model & Database | Predicts protein-ligand binding affinity (Boltz-2). SAIR provides a training set of folded protein-ligand complexes. | Open Source / Open Access |
| AOP-Wiki & AOP-DB [27] [28] | Knowledge Base & Database | Central repository for developing and searching Adverse Outcome Pathways. The place to integrate new structural insights. | Open Access |
| PoseBusters [110] | Validation Tool | Checks the physical plausibility and steric correctness of AI-generated protein-ligand complex structures. | Open Source |
The integration of AI-driven structure prediction, particularly through AlphaFold, into the workflow of domain annotation is transforming molecular biosciences. It is closing the structural annotation gap at an unprecedented scale and pace, moving from a static catalog of known folds to a dynamic, predictive exploration of the entire protein structure universe. For the AOP framework and drug discovery, this means a transition from qualitative, descriptive pathways to quantitative, structurally-grounded mechanistic models.
Future directions will focus on overcoming current limitations, primarily the prediction of conformational dynamics and transient states crucial for understanding allosteric regulation and signaling pathways [108] [107]. The integration of temporal and environmental data into models, along with the rise of multimodal AI that jointly reasons across sequence, structure, and chemical space, will further deepen our functional understanding. As these tools mature, the vision of a fully annotated, mechanistic, and predictive map of biological pathways—from chemical interaction to organism-level outcome—comes within reach, promising more efficient and precise drug development and chemical risk assessment.
Conclusion
A coherent understanding of 'domains'—spanning the highest taxonomic rank of organisms, dimensional research constructs, and fundamental protein units—is indispensable for modern biomedical science. This multidimensional perspective, as detailed through foundational concepts, methodological applications, troubleshooting, and validation, provides a powerful scaffold for hypothesis generation and problem-solving. For drug discovery, integrating these layers—from the evolutionary history of a target protein's domain to the clinical phenotype defined by research criteria—offers a path to more precise and translatable therapies. Future progress hinges on the continued development of integrated databases, the application of AI to structural prediction, and a commitment to dimensional, biology-driven research frameworks that transcend traditional diagnostic silos [citation:2][citation:7]. Embracing this holistic view of taxonomic domains will be crucial for unlocking new biological insights and accelerating the development of effective treatments.
References
- 1. Three-domain system [https://en.wikipedia.org/wiki/Three-domain_system]
- 2. 1.3: Classification - The Three Domain System [https://bio.libretexts.org/Bookshelves/Microbiology/Microbiology_(Kaiser)/Unit_1%3A_Introduction_to_Microbiology_and_Prokaryotic_Cell_Anatomy/1%3A_Fundamentals_of_Microbiology/1.3%3A_Classification_-_The_Three_Domain_System]
- 3. The Three Domains of Life | News [https://astrobiology.nasa.gov/news/the-three-domains-of-life/]
- 4. In defence of the three-domains of life paradigm - PMC [https://pmc.ncbi.nlm.nih.gov/articles/PMC5604501/]
- 5. Deep origin of eukaryotes outside Heimdallarchaeia within ... [https://www.nature.com/articles/s41586-025-08955-7]
- 6. Dispatch Evolution: Two Domains of Life or Three? [https://www.sciencedirect.com/science/article/pii/S0960982220300105]
- 7. Characterizing organisms from three domains of life with ... [https://www.nature.com/articles/s41597-025-05423-9]
- 8. Three-Dimensional in Vitro Cell Culture Models in Drug ... [https://pmc.ncbi.nlm.nih.gov/articles/PMC5787088/]
- 9. Pathway for Development and Validation of Multi-domain ... [https://link.springer.com/article/10.1007/s43441-024-00641-6]
- 10. Two-domain system [https://en.wikipedia.org/wiki/Two-domain_system]
- 11. Analysis of the relationship between rod cell membrane ... [https://www.nature.com/articles/s41598-025-95998-5]
- 12. Research on noninvasive electrophysiologic imaging based ... [https://pmc.ncbi.nlm.nih.gov/articles/PMC12039130/]
- 13. Beyond society: the evolution of organismality - PMC [https://pmc.ncbi.nlm.nih.gov/articles/PMC2781869/]
- 14. Genomic Expansion of Domain Archaea Highlights Roles ... [https://www.sciencedirect.com/science/article/pii/S0960982215000160]
- 15. The Extremophiles: Adaptation Mechanisms and ... [https://pmc.ncbi.nlm.nih.gov/articles/PMC12024854/]
- 16. Research Domain Criteria [https://en.wikipedia.org/wiki/Research_Domain_Criteria]
- 17. About RDoC - National Institute of Mental Health (NIMH) [https://www.nimh.nih.gov/research/research-funded-by-nimh/rdoc/about-rdoc]
- 18. The Research Domain Criteria framework: transitioning ... [https://psychiatry-psychopharmacology.com/en/the-research-domain-criteria-framework-transitioning-from-dimensional-systems-to-integrating-neuroscience-and-psychopathology-13568]
- 19. Revisiting the seven pillars of RDoC | BMC Medicine | Full Text [https://bmcmedicine.biomedcentral.com/articles/10.1186/s12916-022-02414-0]
- 20. Linking RDoC and HiTOP: A new interface for advancing ... [https://pmc.ncbi.nlm.nih.gov/articles/PMC8165014/]
- 21. Developers' Handbook 2.5 [https://aopwiki.org/handbooks/3]
- 22. Neuroscience-informed classification of prevention ... [https://www.sciencedirect.com/science/article/abs/pii/S0149763424000472]
- 23. Defining the Biologically Plausible Taxonomic Domain of ... [https://pmc.ncbi.nlm.nih.gov/articles/PMC10100214/]
- 24. digital phenotyping via smartphones and connected devices [https://www.nature.com/articles/tp201725]
- 25. Protein domain identification methods and online resources [https://pmc.ncbi.nlm.nih.gov/articles/PMC7895673/]
- 26. comprehensive database of protein domains-ligands/drugs ... [https://www.sciencedirect.com/science/article/pii/S2001037025003782]
- 27. Comprehensive mapping of the AOP-Wiki database [https://www.frontiersin.org/journals/toxicology/articles/10.3389/ftox.2024.1285768/full]
- 28. Adverse Outcome Pathway Database (AOP-DB) [https://www.epa.gov/healthresearch/adverse-outcome-pathway-database-aop-db]
- 29. Quantitative description and classification of protein ... [https://www.nature.com/articles/s41598-019-52766-6]
- 30. Protein Structure Analysis Workflow [https://cran.r-project.org/web/packages/protti/vignettes/protein_structure_workflow.html]
- 31. AOP Forum - AOP-Wiki [https://forum.aopwiki.org/portal.php]
- 32. Beyond evolution: De novo designed protein toolkit ... [https://pmc.ncbi.nlm.nih.gov/articles/PMC12624534/]
- 33. Classification of Life [https://manoa.hawaii.edu/exploringourfluidearth/biological/what-alive/classification-life]
- 34. Molecular Phylogeny - an overview [https://www.sciencedirect.com/topics/immunology-and-microbiology/molecular-phylogeny]
- 35. Comprehensive mapping of the AOP-Wiki database [https://pmc.ncbi.nlm.nih.gov/articles/PMC10958381/]
- 36. Molecular Phylogenetics - Genomes - NCBI Bookshelf - NIH [https://www.ncbi.nlm.nih.gov/books/NBK21122/]
- 37. Guide to molecular databases and ... [https://www.protocols.io/view/guide-to-molecular-databases-and-molecular-phylog-deaj3acn.html]
- 38. Expasy - SIB Swiss Institute of Bioinformatics [https://www.expasy.org/]
- 39. BLAST: Basic Local Alignment Search Tool [https://blast.ncbi.nlm.nih.gov/Blast.cgi]
- 40. AI can now model and design the genetic code for all ... [https://arcinstitute.org/news/evo2]
- 41. AOPWIKI-EXPLORER: An interactive graph-based query ... [https://www.sciencedirect.com/science/article/pii/S2468111324000100?dgcid=rss_sd_all]
- 42. New Developments in Psychiatric Classification [https://pmc.ncbi.nlm.nih.gov/articles/PMC12181037/]
- 43. Could a genetic disorder with psychiatric symptoms help fill ... [https://www.nature.com/articles/s41398-020-00964-6]
- 44. The Research Domain Criteria Project (RDoC) [https://www.elsevier.es/en-revista-revista-psiquiatria-salud-mental-486-articulo-translational-research-in-psychiatry-the-S2173505019300342]
- 45. RDoC Matrix - National Institute of Mental Health (NIMH) - NIH [https://www.nimh.nih.gov/research/research-funded-by-nimh/rdoc/constructs/rdoc-matrix]
- 46. Psychotherapy Research Domain Criteria: functional ... [https://www.frontiersin.org/journals/psychiatry/articles/10.3389/fpsyt.2025.1549976/full]
- 47. Research Domain Criteria (RDoC) Constructs of Acute and ... [https://www.sciencedirect.com/science/article/pii/S2949732925000134]
- 48. The history of the CATH structural classification of protein ... [https://pmc.ncbi.nlm.nih.gov/articles/PMC4678953/]
- 49. Manual classification strategies in the ECOD database - PMC [https://pmc.ncbi.nlm.nih.gov/articles/PMC4624060/]
- 50. Structural Classification of Proteins database [https://en.wikipedia.org/wiki/Structural_Classification_of_Proteins_database]
- 51. CATH [https://www.rcsb.org/docs/search-and-browse/browse-options/cath]
- 52. Merizo: a rapid and accurate protein domain segmentation ... [https://pmc.ncbi.nlm.nih.gov/articles/PMC10730818/]
- 53. Recent advances in target identification technology of ... [https://www.sciencedirect.com/science/article/abs/pii/S0163725825000452]
- 54. Comprehensive database of protein domains-ligands ... [https://pubmed.ncbi.nlm.nih.gov/41017823/]
- 55. IID 2025: Physical protein interaction data with detection ... [https://pubmed.ncbi.nlm.nih.gov/41296544/]
- 56. PLM-interact: extending protein language models to predict ... [https://www.nature.com/articles/s41467-025-64512-w]
- 57. Advancing Generic Drug Development ... [https://www.fda.gov/drugs/news-events-human-drugs/advancing-generic-drug-development-translating-science-approval-2025-10072025]
- 58. AI- and Ontology-Based Enhancements to FMEA for ... [https://arxiv.org/html/2511.17743v1]
- 59. 2025 New Drug Approvals: Key FDA and EMA ... [https://www.tribecaknowledge.com/blog/2025-new-drug-approvals-key-fda-and-ema-approvals-and-emerging-trends]
- 60. How will FDA changes reshape drug approval in 2025 and ... [https://cen.acs.org/pharmaceuticals/drug-development/FDA-changes-reshape-drug-approval/103/web/2025/05]
- 61. Automated Semantic Annotation of Data Management Plans [https://datascience.codata.org/articles/10.5334/dsj-2025-016]
- 62. Three-domain system [https://grokipedia.com/page/Three-domain_system]
- 63. Arguments Reinforcing the Three-Domain View of ... [https://pmc.ncbi.nlm.nih.gov/articles/PMC5165138/]
- 64. An expert study on hierarchy comparison methods applied ... [https://pmc.ncbi.nlm.nih.gov/articles/PMC7924413/]
- 65. Ten simple rules to colorize biological data visualization - PMC [https://pmc.ncbi.nlm.nih.gov/articles/PMC7561171/]
- 66. 5.2: Acellular Entities - Viruses, Prions, and Viroids [https://bio.libretexts.org/Courses/CT_State_Northwestern/General_Biology_I_and_II/05%3A_Unit_V-_Biological_Diversity/5.2%3A_Acellular_Entities_-_Viruses_Prions_and_Viroids]
- 67. Prion Diseases and Their Challenges - NCBI - NIH [https://www.ncbi.nlm.nih.gov/books/NBK221307/]
- 68. Vertebrate Prions [https://ictv.global/report_9th/subviral/Vertebrate-Prions]
- 69. From Slow Viruses to Prions - PMC [https://pmc.ncbi.nlm.nih.gov/articles/PMC4936725/]
- 70. Scientists Discovered a New Creature That Exists at the ... [https://www.popularmechanics.com/science/animals/a65193552/archaea-cell-virus/]
- 71. Prion-like Domains in Eukaryotic Viruses | Scientific Reports [https://www.nature.com/articles/s41598-018-27256-w]
- 72. Deep learning for microbial life detection in ... [https://www.nature.com/articles/s41598-025-29239-0]
- 73. Bridging the gap between preclinical and clinical research [https://pmc.ncbi.nlm.nih.gov/articles/PMC10043823/]
- 74. Lost in translation: the valley of death across preclinical and ... [https://transmedcomms.biomedcentral.com/articles/10.1186/s41231-019-0050-7]
- 75. What Is the Translational Gap and How Do You Close It? [https://www.verisimlife.com/publications-blog/what-is-the-translational-gap]
- 76. Bridging the Gap: Translating Preclinical Biomarkers to ... [https://blog.crownbio.com/bridging-the-gap-translating-preclinical-biomarkers-to-clinical-success]
- 77. Inclusion of evidence for domain of applicability - AOP Forum [https://forum.aopwiki.org/showthread.php?tid=215]
- 78. Integrating translational and clinical research to advance ... [https://www.ddw-online.com/how-integrating-translational-and-clinical-research-can-advance-drug-development-37444-202510/]
- 79. Multi-domain and complex protein structure prediction using ... [https://pmc.ncbi.nlm.nih.gov/articles/PMC10692239/]
- 80. Deep-learning-based single-domain and multidomain ... [https://www.nature.com/articles/s41587-025-02654-4]
- 81. Multidomain protein structure prediction using information ... [https://pmc.ncbi.nlm.nih.gov/articles/PMC7246089/]
- 82. CONSORT 2025 explanation and elaboration - PubMed Central [https://pmc.ncbi.nlm.nih.gov/articles/PMC11995452/]
- 83. SPIRIT 2025 statement: Updated guideline for protocols of ... [https://pmc.ncbi.nlm.nih.gov/articles/PMC12037212/]
- 84. Linnaean taxonomy [https://en.wikipedia.org/wiki/Linnaean_taxonomy]
- 85. Two-empire system [https://en.wikipedia.org/wiki/Two-empire_system]
- 86. Two empires or three? - PMC [https://pmc.ncbi.nlm.nih.gov/articles/PMC33883/]
- 87. Eocyte hypothesis [https://en.wikipedia.org/wiki/Eocyte_hypothesis]
- 88. Phylogenomics provides robust support for a two-domains ... [https://pmc.ncbi.nlm.nih.gov/articles/PMC6942926/]
- 89. The eocyte hypothesis and the origin of eukaryotic cells [https://pmc.ncbi.nlm.nih.gov/articles/PMC2629348/]
- 90. A data-driven latent variable approach to validating the ... [https://www.nature.com/articles/s41467-025-55831-z]
- 91. A Research Domain Criteria (RDoC)-Guided Dashboard to ... [https://pubmed.ncbi.nlm.nih.gov/36097251/]
- 92. Structural features of the protein kinase domain and targeted ... [https://pmc.ncbi.nlm.nih.gov/articles/PMC9382423/]
- 93. Protein kinases in neurodegenerative diseases [https://www.nature.com/articles/s41392-025-02179-x]
- 94. G protein-coupled receptors (GPCRs): advances in ... [https://www.nature.com/articles/s41392-024-01803-6]
- 95. Structure, function and drug discovery of GPCR signaling - PMC [https://pmc.ncbi.nlm.nih.gov/articles/PMC10695916/]
- 96. Review article Data-oriented protein kinase drug discovery [https://www.sciencedirect.com/science/article/pii/S0223523424002939]
- 97. Structural Changes Due to Antagonist Binding in Ligand ... [https://pmc.ncbi.nlm.nih.gov/articles/PMC5962723/]
- 98. Comparison of ATP-binding pockets and discovery ... [https://www.sciencedirect.com/science/article/pii/S0968089622003169]
- 99. Isoform-Selective Enzyme Inhibitors by Exploring Pocket ... [https://pmc.ncbi.nlm.nih.gov/articles/PMC7642266/]
- 100. A generalizable deep learning framework for structure ... [https://pmc.ncbi.nlm.nih.gov/articles/PMC12557521/]
- 101. Developers' Handbook 2.7 [https://aopwiki.org/handbooks/5]
- 102. Artificial intelligence in bioinformatics: a survey - PMC [https://pmc.ncbi.nlm.nih.gov/articles/PMC12596291/]
- 103. Species delimitation 4.0: integrative taxonomy meets ... [https://www.sciencedirect.com/science/article/pii/S0169534723002963]
- 104. Integrating artificial intelligence into small molecule ... [https://www.nature.com/articles/s44386-025-00029-y]
- 105. Application and Comparison of Machine Learning and ... [https://pmc.ncbi.nlm.nih.gov/articles/PMC11135637/]
- 106. New Assay Technology Could Reshape Approach to Drug ... [http://ncats.nih.gov/news-events/news/new-assay-technology-could-reshape-approach-drug-discovery]
- 107. High-resolution protein modeling through Cryo-EM and AI [https://pmc.ncbi.nlm.nih.gov/articles/PMC12590954/]
- 108. [The development of AlphaFold and its applications in ... [https://pubmed.ncbi.nlm.nih.gov/40661027/]
- 109. AlphaFold Protein Structure Database [https://alphafold.ebi.ac.uk/]
- 110. AI Models Enhance the Drug Discovery Portfolio [https://www.genengnews.com/topics/artificial-intelligence/ai-models-enhance-the-drug-discovery-portfolio/]
- 111. RepeatsDB in 2025: expanding annotations of structured ... [https://pmc.ncbi.nlm.nih.gov/articles/PMC11701623/]
- 112. Structural and functional insights into internal domain ... [https://www.nature.com/articles/s41598-025-25367-9]
- 113. The Future of AI in Drug Development: 10 Trends That Will ... [https://huspi.com/blog-open/the-future-of-ai-in-drug-development-10-trends-that-will-redefine-rd/]