Problem Formulation in Ecological Risk Assessment: The Foundational Step for Scientific Rigor and Decision-Making
This article provides a comprehensive guide to problem formulation, the critical first phase of ecological risk assessment (ERA) that determines the scientific validity and regulatory utility of the entire process.
Problem Formulation in Ecological Risk Assessment: The Foundational Step for Scientific Rigor and Decision-Making
Abstract
This article provides a comprehensive guide to problem formulation, the critical first phase of ecological risk assessment (ERA) that determines the scientific validity and regulatory utility of the entire process. Tailored for researchers, scientists, and drug development professionals, it explores the foundational principles of defining management goals and engaging in planning dialogue. It details the methodological framework for selecting assessment endpoints, developing conceptual models, and creating analysis plans. The article further addresses troubleshooting common challenges like data gaps and stakeholder conflicts and discusses validation techniques and comparative analysis with other assessment frameworks. By synthesizing current EPA guidelines and scientific literature, this resource aims to equip professionals with the knowledge to design robust, actionable, and defensible ecological risk assessments[citation:1][citation:2][citation:3].
The Cornerstone of Assessment: Defining Scope and Goals in Problem Formulation
Problem Formulation (PF) is the critical first phase of an Ecological Risk Assessment (ERA), a structured scientific process used to evaluate the likelihood of adverse effects on plants and animals from exposure to stressors such as chemical contaminants [1]. It functions as the strategic planning and scoping stage where risk assessors and managers collaboratively define the assessment's purpose, scope, and methodology [2] [3]. Within a broader thesis on ERA research, PF is the keystone that ensures scientific inquiry remains focused, relevant, and aligned with regulatory and management needs. Its primary role is to transform broad environmental concerns into a testable analytical plan, thereby preventing misallocation of resources and providing clarity for subsequent phases of analysis and risk characterization [4].
The regulatory landscape governing PF is dynamic, as evidenced by ongoing revisions to frameworks like the U.S. Toxic Substances Control Act (TSCA) Risk Evaluation rule. Recent proposals emphasize shifting from a "whole chemical" risk determination to making individual determinations for each condition of use, highlighting how regulatory interpretations directly influence the scope and boundaries established during PF [5]. Furthermore, definitions of key terms, such as "potentially exposed or susceptible subpopulation," are under active review, underscoring the need for precise terminology from the outset of the assessment [5].
Core Components and Process of Problem Formulation
Problem formulation is an iterative, collaborative process involving risk assessors, risk managers, and stakeholders [3]. It integrates available information to produce three essential products: assessment endpoints, a conceptual model, and an analysis plan [2] [3]. The process systematically evaluates stressors, exposure pathways, and ecological receptors to define the problem with scientific and operational rigor.
The following table summarizes the key informational elements integrated during problem formulation:
Table: Key Informational Elements Integrated During Problem Formulation [2] [3]
| Factor | Core Considerations | Example Questions for Assessment |
|---|---|---|
| Stressors | Type, characteristics, mode of action, toxicity, frequency, duration, distribution, intensity. | Is the stressor chemical, physical, or biological? Is it acute, chronic, bioaccumulative, or persistent? |
| Sources | Status (active/inactive), background levels, spatial scale. | What is the geographic extent of the source? What are the baseline environmental conditions? |
| Exposure | Media (air, water, soil), timing, pathways. | When does exposure occur relative to critical life cycles? What are the routes of exposure (ingestion, inhalation, dermal)? |
| Receptors | Types (species, communities), life history characteristics, sensitivity, trophic level. | What keystone, endangered, or commercially valuable species are present? Are there sensitive life stages? |
Defining Assessment Endpoints
Assessment endpoints are explicit expressions of the environmental values to be protected, operationally defined by an ecological entity and its important attributes [2] [3]. They are derived directly from management goals (e.g., "maintain a sustainable aquatic community") and bridge policy with science. For example, a management goal to protect biodiversity may be translated into an assessment endpoint of "reproductive success of a resident fish population," where the fish population is the entity and reproduction is the critical attribute [4].
Developing the Conceptual Model
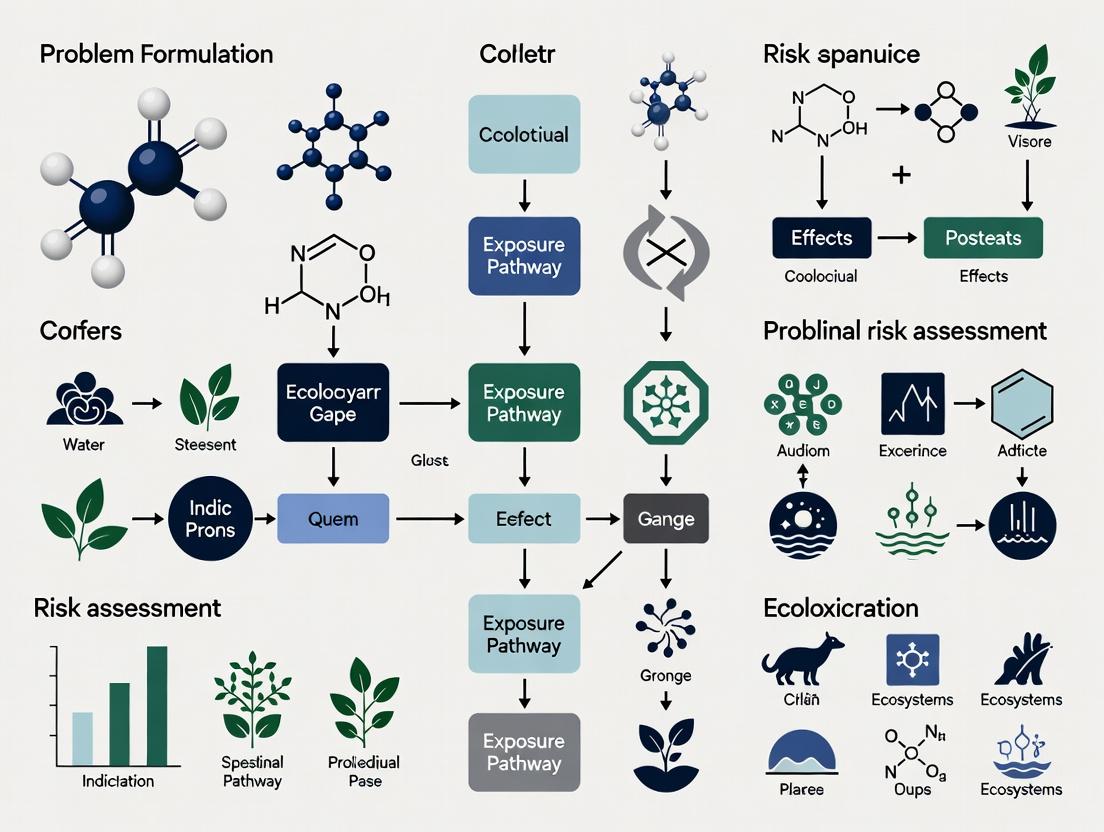
The conceptual model is a written description and visual representation (typically a diagram) of the predicted relationships between stressors, exposure pathways, and assessment endpoints [2]. It illustrates the risk hypotheses—tentative explanations about how an effect might occur—and is vital for identifying data gaps and ranking components by uncertainty [2]. The diagram below outlines the logical flow and primary components of a standard ERA conceptual model.
Diagram 1: Generalized Conceptual Model for Ecological Risk Assessment
Crafting the Analysis Plan
The final stage of PF is developing the analysis plan, which details how the risk hypotheses will be evaluated. It specifies the assessment design, data requirements, analytical methods, and measurement endpoints (e.g., LC50, NOAEC) that will be used [2]. This plan ensures the subsequent analysis phase is structured to effectively inform the risk manager's decision [3].
The ERA Framework: Problem Formulation in Context
Problem formulation is the foundation of the tripartite ERA framework, which proceeds to the Analysis phase and concludes with Risk Characterization [6]. The diagram below depicts this phased structure and the iterative relationship between planning and problem formulation.
Diagram 2: The ERA Framework Phases with Feedback
The analysis phase is divided into two parallel lines of inquiry: exposure characterization and ecological effects characterization [6]. These are synthesized in the risk characterization phase to produce an estimate of risk, which directly informs risk management decisions [1]. A poorly executed PF can compromise the entire ERA, leading to requests for irrelevant data, inappropriate risk mitigation, and delays in decision-making that may themselves cause environmental harm [4].
Practical Application: A Tiered Approach and Decision Logic
A common strategy to manage resource constraints is a tiered evaluation approach, which begins with simple, conservative screening assessments and proceeds to more complex, site-specific analyses only as needed [2]. The logic flow for initiating and scoping an ERA, particularly in a regulatory context like pesticide registration, is illustrated below.
Diagram 3: Decision Logic for Initiating and Tiering an ERA
The Scientist's Toolkit: Essential Reagents and Materials
The experimental work within an ERA, particularly in the analysis phase, relies on standardized tools and models. The following table details key research solutions used in ecological effects and exposure characterization.
Table: Key Research Reagent Solutions and Materials for ERA Experiments [2] [3]
| Category / Item | Primary Function in ERA | Specific Application Example |
|---|---|---|
| Standardized Test Organisms | Serve as surrogate species for broad taxonomic groups to assess toxicity. | Laboratory rat (Rattus norvegicus) as a surrogate for mammals; Fathead minnow (Pimephales promelas) for freshwater fish. |
| Toxicity Testing Benchmarks | Quantitative measurement endpoints derived from controlled laboratory tests. | LC50 (Lethal Concentration for 50% of population): Used in acute risk quotients. NOAEC (No Observed Adverse Effect Concentration): Used in chronic risk assessments. |
| Environmental Fate Models | Predict the distribution and persistence of a stressor in the environment. | Pesticide in Water Calculator (PWC): Estimates pesticide concentrations in surface water bodies based on use patterns and environmental parameters. |
| Site Characterization Tools | Identify ecological receptors and exposure pathways at a specific location. | Geographic Information Systems (GIS): Maps habitats, species distributions, and stressor sources to define exposure scenarios. |
| Analytical Reference Standards | Enable accurate quantification of stressor concentrations in environmental media. | Certified chemical reference standards for target analytes (e.g., specific pesticide active ingredients) used in mass spectrometry for water/soil analysis. |
Current Challenges and Evolving Considerations
Problem formulation continues to evolve in response to scientific and regulatory pressures. A significant contemporary challenge is defining the scope of conditions of use within chemical risk evaluations. Recent regulatory proposals debate whether EPA should have discretion to exclude certain de minimis or non-central uses from the assessment scope to focus resources [5]. Furthermore, incorporating considerations for potentially exposed or susceptible subpopulations and overburdened communities adds necessary complexity to defining receptors and exposure scenarios, though the specific regulatory language remains contentious [5].
The principle of using "best available science" and a "weight of scientific evidence" approach, mandated under statutes like TSCA, must be operationalized during PF. This involves planning to evaluate each piece of information based on its quality, relevance, study design, and reliability before integration [5]. Ultimately, a rigorous problem formulation process is the best defense against an ERA that is inefficient, irrelevant, or uncertain, ensuring that the resulting science is actionable for environmental protection [4].
Within ecological risk assessment (ERA) research, problem formulation is not merely a preliminary step but the critical thesis that determines the scientific and managerial validity of the entire endeavor [7]. Planning represents the active, structured process through which this thesis is developed, creating the indispensable bridge between risk assessment (the scientific analysis of potential adverse effects) and risk management (the decisions and actions taken to mitigate those risks) [8]. For researchers and drug development professionals, this phase establishes the scope, endpoints, and methodologies, ensuring that the resulting data is actionable and decision-relevant [2]. This guide posits that rigorous planning, centered on a well-articulated problem formulation, is the principal determinant of an assessment's efficacy in informing environmental protection and sustainable development.
The Core of Planning: Problem Formulation in Ecological Risk Assessment
The U.S. Environmental Protection Agency (EPA) framework identifies problem formulation as the first technical phase following planning dialogues, where the assessment's foundation is built [7] [2]. This stage translates broad management goals into a concrete, testable scientific plan.
Key Components of Problem Formulation
The process integrates available information to define the nature of the problem and create a roadmap for analysis [2].
- Assessment Endpoints: These are explicit expressions of the ecological values to be protected, combining a valued entity (e.g., a fish species, an aquatic community) with a specific attribute of concern (e.g., survival, reproduction, community structure). They are derived directly from management goals [2].
- Conceptual Model: A diagram and narrative describing hypothesized relationships between a stressor (e.g., a pharmaceutical residue) and the assessment endpoint. It identifies potential exposure pathways and ecological effects [2].
- Analysis Plan: A detailed protocol specifying the data requirements, metrics, and methods to be used for the exposure and effects analyses, and the criteria for risk characterization [2].
Experimental Protocol: Developing a Conceptual Model
Objective: To create a conceptual model that diagrams the plausible causal pathways linking a stressor of concern to ecological assessment endpoints. Procedure:
- Identify Stressor Characteristics: Define the source, magnitude, timing, and spatial distribution of the stressor (e.g., effluent concentration, metabolite toxicity) [2].
- Characterize the Ecosystem: Describe the relevant ecological receptors (species, communities, habitats) and the key environmental processes in the exposure setting.
- Diagram Exposure Pathways: Map the potential routes through which the stressor may reach the receptor (e.g., direct contact, dietary ingestion, biomagnification). Use boxes for entities (stressor, receptor, ecosystem component) and arrows for pathways and effects.
- Articulate Risk Hypotheses: For each pathway, formulate a clear, testable statement predicting the nature and likelihood of an adverse effect (e.g., "Chronic exposure to Compound X via surface water will reduce fecundity in Species Y").
- Peer Review and Iteration: Subject the draft model to review by risk managers and scientific experts to ensure completeness and relevance before finalizing the analysis plan [2].
Diagram: Problem Formulation Conceptual Model for Ecological Risk
Quantitative Methodologies for Risk Estimation
A robust problem formulation guides the selection of analytical methodologies. Moving beyond qualitative judgments, advanced quantitative models enable probabilistic risk estimation, which is crucial for managing uncertainty.
Multi-State Fuzzy Bayesian Networks (MFBN)
A cutting-edge approach for ecological risk assessment involves MFBNs, which address data scarcity and uncertainty by integrating Fuzzy Set Theory (FST) and Bayesian Networks (BN) [9]. Traditional binary-state models (normal/failure) are often insufficient for ecological systems where degradation is gradual. MFBNs allow nodes (e.g., a population health metric) to exist in multiple states (e.g., healthy, stressed, severely degraded), providing a more nuanced risk picture [9].
Core Technical Components:
- Fuzzy Set Theory: Handles the inherent vagueness in expert judgments about ecological conditions by using membership functions to quantify the degree to which a condition belongs to a particular state (e.g., "moderately impaired") [9].
- Bayesian Network: A probabilistic graphical model (Directed Acyclic Graph) representing causal relationships among variables. It uses Conditional Probability Tables (CPT) to quantify these relationships and can update probabilities (perform "inference") when new evidence is obtained [9].
- Improved Similarity Aggregation Method (SAM): A technique to reliably aggregate opinions from multiple experts, a common necessity in ecological assessments where empirical data is limited. Improvements may account for expert reliability and reduce aggregation bias [9].
Table 1: Comparison of Risk Factor States in Binary vs. Multi-State Frameworks
| Risk Factor (Example) | Binary State Model | Multi-State (MFBN) Model |
|---|---|---|
| Population Abundance | Viable / Collapsed | High, Moderate, Low, Critically Low |
| Habitat Quality | Suitable / Unsuitable | Optimal, Suitable, Degraded, Lost |
| Water Quality Index | Passing / Failing | Excellent, Good, Fair, Poor |
| Advantage | Simplicity in analysis and communication. | Captures continuum of degradation; enables more sensitive detection of change and refined management triggers. |
Experimental Protocol: Constructing an MFBN for ERA
Objective: To quantitatively estimate the probability of an adverse ecological endpoint by modeling causal relationships under uncertainty. Procedure [9]:
- Develop a Causal Diagram (DAG): Based on the conceptual model, define the network nodes (variables) and directed arcs (causal links). The top node is the assessment endpoint (e.g., "Aquatic Community Integrity").
- Define Node States: For each node, specify 3-5 discrete, ordered states (e.g., for "Dissolved Oxygen": Hypoxic, Low, Adequate, High).
- Elicit Conditional Probabilities: Use expert judgment, informed by literature and data, to populate Fuzzy Conditional Probability Tables (FCPTs) for each child node. The "fuzzy" component translates linguistic expert estimates (e.g., "low probability") into numerical ranges.
- Aggregate Expert Judgments: Apply an Improved SAM to combine inputs from multiple experts into a single, weighted FCPT for each node, enhancing reliability.
- Parameterize and Validate: Use software (e.g., Netica, GeNIe) to build the network. Validate logic by entering extreme evidence and checking if predictions align with expected outcomes.
- Perform Probabilistic Inference: Enter observed or hypothesized evidence for precursor nodes (e.g., "Increased Nutrient Load = High") to compute the updated probability distribution for the assessment endpoint.
Table 2: Characteristics of Key Methodologies for Quantitative Ecological Risk Estimation
| Methodology | Key Feature | Primary Utility in ERA | Data Requirements | Major Challenge |
|---|---|---|---|---|
| Multi-State Fuzzy Bayesian Network (MFBN) | Integrates expert knowledge with probabilistic reasoning under uncertainty. | Predicting endpoint likelihoods from incomplete or qualitative data; diagnostic analysis. | Moderate (Expert elicitation, some empirical data for validation). | Complexity in constructing and validating conditional probability tables. |
| Fault Tree Analysis (FTA) | Deductive, top-down analysis of pathways to system failure. | Identifying combinations of events leading to a specific ecological disaster (e.g., fish kill). | High (Requires reliable failure probabilities for basic events). | Can become unwieldy for complex systems; often static. |
| Probabilistic Risk Assessment (PRA) | Uses distributions for exposure and effects to produce a risk distribution. | Characterizing variability and uncertainty in risk estimates (e.g., risk curves). | High (Substantial empirical data to define distributions). | Computationally intensive; requires robust statistical expertise. |
From Assessment to Action: Components of the Risk Management Plan
The planning process culminates in a Risk Management Plan (RMP)—the strategic document that translates assessment findings into actionable protocols [10] [11]. An effective RMP is dynamic and contains several key components.
Risk Response Planning: For each identified risk, a planned response must be developed. The four primary strategies are [10] [11]:
- Avoidance: Changing plans to eliminate the risk or protect objectives from its impact.
- Mitigation: Taking steps to reduce the probability and/or impact of the risk.
- Transfer: Shifting the risk to a third party (e.g., through insurance).
- Acceptance: Acknowledging the risk without active pursuit of other strategies, often for low-priority risks.
Risk Monitoring and Control: This ongoing process involves tracking identified risks, monitoring residual risks, identifying new risks, and evaluating the effectiveness of response plans throughout the project lifecycle [10]. The use of key risk indicators (KRIs) and regular review cycles is essential.
Diagram: Integrated ERA & Risk Management Planning Workflow
The Scientist's Toolkit: Essential Reagents for Risk Research
Table 3: Research Reagent Solutions for Ecological Risk Assessment & Management
| Tool/Reagent Category | Specific Example/Product | Primary Function in ERA Research |
|---|---|---|
| Bioassay Test Organisms | Ceriodaphnia dubia (Water flea), Pimephales promelas (Fathead minnow), Lemma minor (Duckweed). | Standardized surrogate species for measuring acute and chronic toxicity endpoints (e.g., survival, growth, reproduction) of chemical stressors [2]. |
| Environmental Sampling & Stabilization | Niskin bottles, Van Dorn samplers, acid-washed vials, preservatives (HNO₃ for metals, amber glass for organics). | Collection and preservation of water, sediment, and tissue samples for contaminant analysis without degradation or contamination. |
| Analytical Reference Standards | Certified reference materials (CRMs) for target analytes (e.g., specific pharmaceuticals, pesticides, metabolites). | Calibration of analytical instrumentation (GC-MS, LC-MS/MS) to ensure accurate quantification of stressor concentrations in environmental samples. |
| Data Analysis & Modeling Software | R packages (ecotoxicology, bayesPOP), Bayesian network software (Netica, AgenaRisk), probabilistic tools (Crystal Ball). |
Statistical analysis of dose-response data, population modeling, and implementation of quantitative risk models (e.g., MFBNs, PRA). |
| Risk Tracking & Management Platform | Enterprise Risk Management (ERM) software (e.g., LogicManager, other GRC platforms). | Documenting the risk register, tracking mitigation actions, assigning ownership, and reporting on risk status to stakeholders [11]. |
Within the structured paradigm of ecological risk assessment (ERA), the planning phase is not merely an administrative prelude but the foundational scientific activity that determines the validity, relevance, and utility of the entire assessment [7] [3]. This initial dialogue, focused on identifying and engaging the correct participants, is the cornerstone of effective problem formulation—a phase described as the process of generating and evaluating preliminary hypotheses about why ecological effects have occurred or may occur from human activities [3]. The quality of this planning dialogue directly dictates whether the subsequent scientific assessment will yield decision-relevant outcomes or become an academically rigorous but practically irrelevant exercise [4].
Framed within a broader thesis on problem formulation research, this guide posits that the systematic identification and integration of risk managers, risk assessors, and stakeholders constitute the first critical test of a sound methodological approach. A poorly conceived or executed planning phase can compromise the entire ERA, leading to requests for irrelevant data, misallocation of resources, miscommunication of findings, and ultimately, delayed environmental decision-making [4]. Conversely, a rigorously planned dialogue ensures the assessment is focused on relevant exposure scenarios and plausible consequences, thereby assuring the relevance of ERA outcomes for environmental protection and resource management [7] [4].
The Planning Dialogue: Core Participants and Their Mandates
The planning dialogue is a collaborative, interdisciplinary exercise that defines the goals, scope, and boundaries of the ecological risk assessment [12]. The participants bring distinct but complementary perspectives, knowledge, and authorities to the table. Their early agreement is essential for aligning scientific inquiry with management needs [2].
Table 1: Core Participants in the Ecological Risk Assessment Planning Dialogue
| Participant Role | Primary Responsibility | Typical Affiliation | Key Contribution to Planning |
|---|---|---|---|
| Risk Manager | Has the authority to make or require action to mitigate an identified risk [12]. | Government agencies (e.g., EPA, state environmental departments), regulatory bodies [12]. | Defines regulatory action and management goals; sets scope, funding, and timeline; determines acceptable level of uncertainty [2] [12]. |
| Risk Assessor | Provides scientific and technical expertise to conduct the risk assessment [12]. | Scientists, ecologists, toxicologists, modelers within agencies, consultancies, or academia [13]. | Translates management goals into assessment endpoints; advises on scientific feasibility, data needs, and methodological approach; identifies uncertainties [2] [3]. |
| Stakeholders (Interested Parties) | Represent societal, economic, or ecological interests affected by the decision [12]. | Industry, environmental NGOs, tribal nations, landowners, the scientific community, and the public [12] [3]. | Provide local knowledge, values, and concerns; help identify valued ecological resources and exposure pathways; ensure the assessment considers all relevant issues [12] [1]. |
The interaction between these groups is governed by a need for clear communication. Risk managers must articulate the regulatory need and the decisions they face, while risk assessors must explain what science can and cannot deliver within constraints [2] [3]. Stakeholders ensure the process remains grounded in real-world ecological and social values [1].
Diagram 1: Interaction of Core Participants in the Planning Dialogue
From Dialogue to Protocol: The Problem Formulation Phase
The planning dialogue flows directly into the formal problem formulation phase, where agreements are translated into a concrete scientific protocol [3]. This phase is highly iterative, often circling back to planning as new information emerges [3]. For researchers, this phase involves several key experimental and analytical protocols.
Protocol for Developing Assessment Endpoints
Assessment endpoints operationalize the management goals into measurable ecological entities and their attributes [2] [3].
- Entity Identification: Review planning agreements and stakeholder input to select the ecological entity (e.g., endangered species, keystone species, commercial fish stock, wetland ecosystem) [12].
- Attribute Selection: Choose a relevant attribute of the entity (e.g., survival, reproductive success, population abundance, community structure) that is both ecologically significant and susceptible to the stressor [12] [3].
- Criteria Application: Filter potential endpoints through three criteria: ecological relevance (role in ecosystem function), susceptibility to the stressor, and relevance to management goals [12].
- Endpoint Specification: Explicitly state the endpoint (e.g., "reproductive success of the fathead minnow (Pimephales promelas) population in Lake X") [2] [4].
Protocol for Conceptual Model Development
The conceptual model is a visual and narrative hypothesis of risk [2].
- Information Integration: Compile data on stressor characteristics (source, intensity, timing), potential exposure pathways (e.g., runoff, bioaccumulation), and the ecosystem at risk (habitat, species present, trophic structure) [3].
- Risk Hypothesis Generation: For each assessment endpoint, draft a statement predicting the relationship between stressor exposure and ecological effect (e.g., "Runoff of pesticide Y to the lake will lead to aqueous concentrations that cause reduced fecundity in fathead minnows") [2].
- Diagram Construction: Create a flow diagram (see Diagram 2) linking stressor sources to receptors via exposure pathways, culminating in the assessment endpoint [3]. This identifies data gaps and critical uncertainties.
Protocol for Analysis Plan Design
The analysis plan is the final product of problem formulation, detailing how the risk hypotheses will be evaluated [2].
- Measures and Metrics Selection: Choose specific measurement endpoints (e.g., LC50, NOAEC, modeled environmental concentration) that are quantitatively linked to each assessment endpoint [2] [4].
- Assessment Design: Decide on the scope and complexity (tiered approach), specifying whether to use existing data, models (e.g., exposure simulation), or new field/lab studies [2].
- Data Quality and Uncertainty Plan: Outline required data quality objectives and a framework for characterizing and reporting uncertainties (e.g., model variability, parameter ignorance) [4] [14].
Diagram 2: Iterative Workflow of the Problem Formulation Phase
Table 2: Key Components and Outputs of Problem Formulation
| Component | Description | Research Protocol Consideration | Output |
|---|---|---|---|
| Assessment Endpoints | Explicit expressions of the environmental values to be protected, defined by an ecological entity and its attributes [3]. | Must be measurable, ecologically relevant, and linked to management goals. Often require surrogate species or proxies in testing [2] [12]. | A prioritized list of endpoints (e.g., survival of aquatic invertebrates; sustainable timber yield). |
| Conceptual Model | A written description and visual representation (diagram) of predicted relationships between stressors, exposures, and assessment endpoints [2]. | Serves as the primary testable hypothesis for the ERA. Development requires interdisciplinary input (ecology, chemistry, hydrology) [3]. | A diagram and narrative detailing risk hypotheses, exposure pathways, and ecosystem interactions. |
| Analysis Plan | A detailed plan for the data analysis and risk characterization phase [2]. | Specifies measurement endpoints, data sources (existing studies, models, new experiments), statistical methods, and uncertainty analysis framework [2] [14]. | A documented protocol guiding the Analysis and Risk Characterization phases of the ERA. |
The Scientist's Toolkit: Essential Research Reagent Solutions
For researchers conducting the problem formulation and subsequent analysis, specific tools and resources are indispensable.
Table 3: Research Reagent Solutions for Ecological Risk Assessment
| Tool/Resource Category | Specific Example or Name | Function in Problem Formulation & ERA |
|---|---|---|
| Guidance & Framework Documents | EPA Guidelines for Ecological Risk Assessment (1998) [12]; International Life Sciences Institute (ILSI) Problem Formulation Framework for GM Plants [4]. | Provide standardized protocols, definitions, and conceptual frameworks to ensure consistency, regulatory compliance, and scientific rigor. |
| Ecological Effects Databases | ECOTOX Knowledgebase (EPA); scientific literature repositories (e.g., PubMed, Web of Science). | Source for toxicity data (e.g., LC50, NOAEC) for surrogate and endpoint species to support effects assessment and endpoint selection [2]. |
| Exposure & Fate Models | Pesticide in Water Calculator (PWC); Exposure Analysis Modeling System (EXAMS); AQUATOX ecosystem model [14]. | Simulate environmental fate, transport, and predicted exposure concentrations (PECs) of stressors to inform conceptual models and analysis plans [2] [14]. |
| Species Sensitivity Distributions (SSD) Tools | Bayesian matbugs calculator; SSD-fitting software (e.g., ETX 2.0) [14]. | Model the distribution of toxicity sensitivity across multiple species to derive protective concentration thresholds and characterize ecological risk [14]. |
| Structured Decision Support Tools | Multicriteria Decision Analysis (MCDA) frameworks [14]. | Help integrate technical risk estimates with socio-economic values and management alternatives during planning and risk management phases [14]. |
Articulating Management Goals and Regulatory Context for the Assessment
This technical guide provides a structured framework for explicitly articulating management goals and regulatory contexts within ecological risk assessment (ERA), specifically tailored for pharmaceutical development. Effective problem formulation—the critical first phase of ERA—requires the integration of compliance obligations, corporate sustainability objectives, and methodological rigor to define the scope and acceptability of risk. We dissect contemporary regulatory paradigms, including recent proposed modifications to the U.S. Toxic Substances Control Act (TSCA) process [15] and international management system standards like ISO 37302 [16] [17]. The guide presents standardized protocols for assessment design, data evaluation, and decision-making, incorporating quantitative and qualitative methodologies [18]. Visual workflows and a curated research toolkit are provided to equip scientists and risk assessors with the practical resources necessary to align scientific analysis with strategic organizational and regulatory imperatives.
In ecological risk assessment for drug development, the problem formulation phase transcends mere technical scoping. It is a strategic exercise that translates disparate inputs—corporate environmental goals, regulatory mandates, stakeholder concerns, and scientific uncertainty—into a coherent assessment plan. A poorly articulated foundation here can lead to regulatory delays, misallocated resources, and incomplete risk characterization. This guide posits that explicit documentation of management goals and regulatory context is not ancillary but central to scientifically defensible and decision-relevant ERA. It frames this articulation within the broader thesis that robust problem formulation is the primary determinant of an assessment's efficiency, credibility, and utility for risk management.
Conceptual Foundations: Interlinking Goals, Regulation, and Assessment
Ecological risk assessment operates at the nexus of science and policy. Management goals (e.g., "minimize aquatic impact," "achieve zero non-compliance") provide the value-based endpoints for what constitutes acceptable risk. The regulatory context provides the legal and procedural boundaries and often defines specific assessment requirements. These two elements inform the assessment goals, which are the specific, technical questions the ERA must answer.
Table 1: Core Components of Problem Formulation in ERA
| Component | Definition | Source/Driver | Example in Pharmaceutical ERA |
|---|---|---|---|
| Management Goals | Strategic objectives related to environmental stewardship, sustainability, and corporate responsibility. | Corporate strategy, ESG commitments, internal policies. | "Prevent API (Active Pharmaceutical Ingredient) discharge into surface water from manufacturing sites." |
| Regulatory Context | Laws, regulations, guidelines, and accepted standards governing chemical safety and environmental protection. | Agencies (e.g., US EPA, EMA), International Standards (ISO). | TSCA requirements for existing chemicals [15], FDA regulations on drug environmental assessments. |
| Assessment Goals | The specific, answerable scientific questions derived from management goals and regulatory context. | Synthesis of the above during problem formulation. | "Determine the chronic risk quotient for fish exposed to effluent containing Compound X under realistic worst-case conditions." |
Analysis of the Regulatory and Management Standards Landscape
The regulatory environment for chemical assessment is dynamic. Recent proposals, such as the U.S. Environmental Protection Agency's (EPA) 2025 changes to the TSCA risk evaluation process, exemplify shifts in regulatory philosophy that directly impact problem formulation [15].
Key Regulatory Developments (TSCA Example):
- Conditions of Use (COU) Focus: The EPA proposes returning to evaluating individual COUs separately, reversing a 2024 rule that required a single determination. This allows for more granular risk evaluations [15].
- Consideration of Occupational Controls: The proposed rule would permit the EPA to consider existing occupational exposure controls (e.g., PPE, engineering controls) in the risk evaluation itself, potentially reducing findings of "unreasonable risk" in controlled settings [15].
- Weight of Scientific Evidence: The proposal incorporates a formal definition emphasizing transparent integration of information based on quality and relevance, guiding data evaluation protocols [15].
Concurrently, international management system standards provide a framework for systematically articulating and achieving goals. The ISO 37302:2025 standard for compliance management system effectiveness offers a directly applicable model [16] [17].
ISO 37302 "Three-Dimension" Evaluation Model: This model evaluates effectiveness not just by written rules, but by holistic performance [17]:
- Policies & Procedures: The design and documentation of the management system.
- Behavior & Culture: The implementation and internalization of rules by people.
- Results & Impact: The tangible outcomes and risk control achieved.
For ERA problem formulation, this model underscores that a goal like "comply with TSCA" must be broken down into: having a procedure for ERA, ensuring staff have the competence and culture to execute it properly, and measuring the result in terms of successful regulatory submissions and risk mitigation.
Table 2: Comparison of Regulatory and Management Frameworks Impacting ERA
| Framework | Primary Focus | Relevance to ERA Problem Formulation | Key Concept for Goal Articulation |
|---|---|---|---|
| TSCA (U.S. EPA) [15] | Chemical substance risk to health/environment. | Defines scope (COUs), required data, risk evaluation methodology. | "Conditions of Use," "Potentially Exposed Subpopulations." |
| ISO 37302:2025 [16] [17] | Effectiveness of compliance management systems. | Provides a structure to ensure the ERA process itself is effective and achieves goals. | "Policies-Procedures-Behavior-Results" linkage. |
| OKR (Objectives & Key Results) [19] | Goal-setting and organizational alignment. | Translates high-level management goals into measurable assessment outcomes. | "Objectives" (qualitative goals) linked to "Key Results" (quantitative metrics). |
Methodological Approaches for Integrated Assessment Design
Articulating goals and context must lead to actionable science. This requires selecting and defining appropriate methodologies.
Integrating Quantitative and Qualitative Lines of Evidence: A robust ERA relies on a weight-of-evidence approach [15], combining:
- Quantitative Data: Numerical, statistical analysis (e.g., LC50 values, predicted exposure concentrations). Ideal for testing hypotheses, measuring effects, and generalizing from samples [18].
- Qualitative Data: Descriptive, contextual information (e.g., field observational notes, stakeholder interview transcripts). Essential for understanding complex phenomena, providing depth, and exploring underlying reasons [18].
Experimental and Assessment Protocols:
- Systematic Review Protocol for Data Collection: A pre-defined, transparent plan to identify, select, appraise, and synthesize all relevant existing scientific evidence on the substance of concern. This directly addresses the "weight of scientific evidence" requirement [15].
- Tiered Toxicity Testing Protocol:
- Tier 1 (Standardized Assays): Conduct standardized acute (e.g., 48h Daphnia immobility) and chronic (e.g., 21d fish early-life stage) tests under Good Laboratory Practice (GLP).
- Tier 2 (Mechanistic & Specialized): If risks are indicated, proceed to endocrine disruption assays, sediment toxicity tests, or multi-generational studies to refine the risk characterization.
- Environmental Exposure Modeling Protocol: Define model scenarios (e.g., EU M3/M4 emission scenarios for pharmaceuticals), input parameters (e.g., log Kow, biodegradation half-life), and conduct probabilistic modeling to estimate predicted environmental concentrations (PECs).
Diagram 1: Integrative Framework for ERA Problem Formulation (92 chars)
Practical Implementation: Tools, Visualization, and the Research Toolkit
The Researcher's Toolkit: Essential Reagent & Material Solutions Table 3: Key Research Reagents and Materials for ERA Protocols
| Item/Category | Function in ERA | Example/Specification |
|---|---|---|
| Standard Test Organisms | Represent trophic levels in aquatic/terrestrial ecotoxicity tests. | Daphnia magna (cladoceran), Danio rerio (zebrafish embryo), Eisenia fetida (earthworm). Must be from certified, culture-stable sources. |
| Reference Toxicants | Validate test organism health and response sensitivity. | Potassium dichromate (for Daphnia), Copper sulfate (for fish). Used in periodic positive control tests. |
| Formulation Vehicle Controls | Ensure test substance effects are not confounded by delivery agent. | HPLC-grade water, acetone, dimethyl sulfoxide (DMSO) at minimal, non-toxic concentrations (e.g., <0.1%). |
| Environmental Matrices | For fate and bioavailability studies. | Standard natural soils/sediments, synthetic surface waters. Characterized for pH, OC%, particle size. |
| Analytical Standards | Quantify test substance concentration and degradation products. | Certified reference material (CRM) of the Active Pharmaceutical Ingredient (API) and major metabolites. |
| Enzymatic/Molecular Assay Kits | Assess sub-organismal, mechanistic endpoints (e.g., oxidative stress, genotoxicity). | Comet assay kit, EROD activity assay, Lipid peroxidation (MDA) assay. |
Visualizing the Assessment Workflow: A clear, staged workflow is critical for project management and regulatory transparency.
Diagram 2: Staged Ecological Risk Assessment Workflow (76 chars)
Diagram Specification for Scientific Communication: All diagrams must adhere to visual accessibility principles. The specified color palette (#4285F4, #EA4335, #FBBC05, #34A853, #FFFFFF, #F1F3F4, #202124, #5F6368) provides sufficient differentiation. Critical contrast rules are enforced: arrow/text colors are explicitly set against node backgrounds (e.g., white text on dark blue, dark text on light yellow) [20] [21]. The WCAG 2.1 contrast standard (minimum 4.5:1 for text) should be verified using tools for scientific figures intended for publication [20] [22].
The future of problem formulation in ERA lies in greater dynamic integration and predictive capability. Emerging trends include:
- Real-Time Data Integration: Leveraging environmental monitoring data from sensors (IoT) to dynamically update exposure scenarios.
- Adoption of New Assessment Criteria (NAC): Incorporating endpoints related to biodiversity, ecosystem services, and climate resilience into management goals.
- Advanced Predictive Tools: Increased use of (Q)SAR, read-across, and mechanistic pathway-based models (e.g., AOPs) to prioritize testing and fill data gaps intelligently.
In conclusion, articulating management goals and regulatory context is a deliberate, structured process that forms the bedrock of a credible and useful ecological risk assessment. By employing the frameworks, protocols, and tools outlined in this guide—from ISO effectiveness models [17] and TSCA compliance strategies [15] to integrated quantitative-qualitative methods [18] and structured visual workflows—researchers and drug development professionals can ensure their scientific assessments are precisely aligned with the strategic and regulatory imperatives that ultimately define success. This alignment is the core of sophisticated problem formulation and the key to defensible environmental risk management.
Within the discipline of ecological risk assessment (ERA), problem formulation is the critical, foundational phase that determines the entire trajectory and feasibility of a study. It is the process of defining the nature, scope, and boundaries of the assessment based on the interplay between management goals and scientific inquiry [7]. For researchers, scientists, and drug development professionals, this phase is not merely an academic exercise; it is a strategic planning activity that directly aligns the assessment's ambitions with the practical constraints of available resources—including time, budget, personnel, and technological access.
The central thesis of this guide is that a rigorously defined problem formulation, executed with resource constraints as a guiding parameter, is the most effective mechanism for ensuring scientific robustness and regulatory relevance without overextending capabilities. This document provides a technical framework for making informed decisions on assessment scope, scale, and complexity, integrating traditional ERA principles with modern New Approach Methodologies (NAMs) to optimize resource efficiency [23]. As regulatory landscapes evolve, such as as the recent EU pharmaceutical legislation that expands requirements to cover the entire product lifecycle and legacy substances, the pressure to conduct thorough yet efficient assessments has never been greater [24].
The EPA Framework: A Scaffold for Scoping Decisions
The U.S. Environmental Protection Agency's (EPA) ecological risk assessment framework provides a well-established, three-phase structure that inherently accommodates resource-based scoping decisions [7]. The process begins with Planning, a collaborative stage involving risk assessors, risk managers, and stakeholders to define the assessment's purpose and constraints [25]. This leads directly into the formal Problem Formulation phase, where the specific questions, endpoints, and analysis plans are defined [7]. The subsequent Analysis (exposure and effects) and Risk Characterization phases are then designed and executed within the boundaries established at the outset.
This framework emphasizes that the interaction between risk assessors and managers at the beginning and end of the process is critical for ensuring the assessment's output is actionable and its scale is appropriate [25]. The following diagram illustrates this iterative framework, highlighting the key decision points where resource availability directly influences the pathway and tools selected.
Diagram: The Iterative Ecological Risk Assessment Framework with Resource Constraints. Resources act as both constraints and enablers at key decision points, shaping the problem formulation and methodological choices.
A Tiered Approach to Defining Scope and Complexity
A tiered, or phased, approach is the most pragmatic strategy for managing resources. It allows an assessment to begin with a conservative, screening-level evaluation using readily available data and models, progressing to more complex and costly studies only if initial results indicate potential risk.
Table 1: Tiered Assessment Approach Aligned with Resource Investment
| Assessment Tier | Typical Scope & Complexity | Key Resource Requirements | Output & Decision Point |
|---|---|---|---|
| Tier 1: Screening | Initial, conservative evaluation. Uses generic exposure models (e.g., EpiSuite), published toxicity data (QSARs), and default safety factors [26] [27]. | Low. Relies on literature, free software, and existing data. Minimal personnel time. | Identification of potential risk. If risk is indicated, proceed to Tier 2. If no risk, assessment may stop. |
| Tier 2: Refined | More realistic, site- or product-specific assessment. Uses measured or modeled environmental concentrations, species-specific toxicity data, and refined safety factors [27]. | Moderate to High. Requires field sampling, chemical analysis, or standardized toxicity testing. Significant personnel and lab resources. | Quantified risk estimate. Determines if risk is confirmed and whether mitigation or further study (Tier 3) is needed. |
| Tier 3: Comprehensive | Detailed, definitive risk characterization. May involve multi-species or mesocosm studies, probabilistic modeling, and investigation of complex endpoints (e.g., endocrine disruption, population-level effects) [24]. | Very High. Demands specialized experimental setups, long-term studies, and advanced analytical or modeling expertise. | Definitive risk characterization. Supports complex regulatory decisions (e.g., market authorization refusal based on environmental risk [24]). |
Integrating New Approach Methodologies (NAMs) for Resource Efficiency
NAMs, which include in vitro assays, computational models, and 'omics technologies, offer a paradigm shift for conducting robust assessments under resource constraints. They can reduce reliance on costly and time-consuming whole-organism vertebrate testing while providing deeper mechanistic understanding [23]. Their integration is a central theme in modern problem formulation.
For instance, in pharmaceutical development, human-relevant cardiac NAMs like human-induced pluripotent stem cell-derived cardiomyocytes (hiPSC-CMs) are being validated to screen for toxicity earlier in the pipeline, preventing costly late-stage attrition [28]. In environmental assessment, a framework integrating in vitro bioassays, Quantitative Structure-Activity Relationship (QSAR) models, and historical in vivo data can identify the most sensitive species based on evolutionary conservation of biological targets, streamlining testing focus [23].
The strategic integration of NAMs into a tiered assessment workflow is illustrated below. This pathway demonstrates how traditional and novel tools can be sequenced to maximize information gain while responsibly allocating resources.
Diagram: Strategic Integration of NAMs into a Tiered Assessment Workflow. Dashed lines show how NAMs inform and refine traditional testing, optimizing resource use across tiers.
Quantitative Decision Points: Data Quality and Uncertainty Factors
A resource-conscious assessment requires clear criteria for deciding when available data are sufficient. This involves evaluating Data Quality and transparently applying Uncertainty (Safety) Factors.
Table 2: Data Quality Objectives (DQOs) for Resource Planning
| Data Quality Tier | Description | Suitable for Assessment Tier | Implications for Resource Planning |
|---|---|---|---|
| Tier 1 (Screening) | Estimated data. QSAR predictions, read-across from analogues, conservative generic models (e.g., 100% release to water). | Tier 1 Screening Assessments. | Minimal resource expenditure. Allows for rapid prioritization of substances or sites. |
| Tier 2 (Refined) | Verified or measured data. Validated laboratory studies, site-specific monitoring data under representative conditions, measured physicochemical properties. | Tier 2 Refined Assessments and higher. | Requires investment in analytical chemistry, standardized testing, or curated database access. |
| Tier 3 (Definitive) | High-resolution, definitive data. GLP-compliant studies, field-validated measurements, probabilistic exposure models, multi-generational or community-level effects data. | Tier 3 Comprehensive Assessments, critical regulatory decisions. | Demands significant resources for complex study execution and expert statistical analysis. |
Uncertainty factors (UFs) are applied to account for gaps in knowledge, such as extrapolating from laboratory to field conditions or from limited species data to an entire ecosystem [27]. Historically, default factors (e.g., 10, 100) are used, but a resource-efficient strategy is to replace default UFs with data. Investing in a key study to reduce a major uncertainty can be more scientifically defensible and, in the long run, more efficient than applying a large, conservative UF that may trigger unnecessary Tier 3 testing [27]. The choice is a direct trade-off between the cost of additional research and the cost (or risk) of potential over- or under-protection.
Experimental Protocols for Key Methodologies
Adopting standardized protocols ensures data quality and interoperability, which is crucial when integrating data from various sources under limited resources. Below are detailed methodologies for two pivotal techniques: one for exposure assessment (Solid Phase Extraction for pharmaceuticals in water) and one for effects assessment (a guideline for implementing NAMs).
Protocol 1: Solid Phase Extraction (SPE) and HPLC-MS Analysis for Pharmaceutical Compounds in Water [26]
- Objective: To extract, concentrate, and quantify trace levels of pharmaceutical compounds from aqueous environmental samples (e.g., wastewater, surface water).
- Materials: Hydrophilic-Lipophilic-Balanced (HLB) SPE cartridges (200 mg, 6 mL), vacuum manifold, HPLC system coupled with Diode Array Detector and Mass Spectrometer (HPLC-DAD-MS), 0.45 μm PTFE filters.
- Procedure:
- Sample Collection & Preservation: Collect water samples in pre-rinsed amber glass bottles. Acidify to pH ~2 (if required for target analytes) and store at 4°C. Process within 24 hours.
- Sample Preparation: Filter 500 mL of water through a 0.45 μm PTFE membrane to remove suspended solids.
- SPE Cartridge Conditioning: Condition the HLB cartridge with 5 mL of methanol, followed by 5 mL of reagent water (pH adjusted to match sample). Do not let the sorbent dry.
- Sample Loading: Pass the filtered sample through the cartridge at a controlled flow rate of 1-10 mL/min.
- Cartridge Washing: Wash with 5-10 mL of a mild aqueous solution (e.g., 5% methanol in water) to remove interfering matrix components.
- Elution: Dry the cartridge under vacuum for 10-20 minutes. Elute analytes into a collection vial with 5-10 mL of an organic solvent (e.g., methanol or acetonitrile).
- Concentration: Gently evaporate the eluate to near dryness under a stream of nitrogen and reconstitute in a smaller volume (e.g., 200 μL) of injection solvent compatible with HPLC.
- Analysis: Inject onto HPLC-DAD-MS. Quantify using external calibration curves prepared from authentic standards.
Protocol 2: Framework for Integrating NAMs into an Ecological Effects Assessment [23]
- Objective: To utilize mechanistic, non-animal data to inform and potentially reduce the need for whole-organism vertebrate ecotoxicity tests.
- Materials: In vitro bioassay kits (e.g., for estrogen receptor binding), computational toxicology software (e.g., for QSAR), access to curated toxicity databases (e.g., ECOTOX), historical in vivo data.
- Procedure:
- Define the Adverse Outcome Pathway (AOP): For the stressor of concern, review literature to establish a plausible AOP, identifying the Molecular Initiating Event (MIE) and Key Events leading to an adverse ecological outcome.
- Select Appropriate NAMs: Choose in vitro assays that measure the MIE or early Key Events (e.g., receptor activation, gene expression). Select in silico tools (QSAR) to predict physicochemical properties and baseline toxicity.
- Generate and Gather Mechanistic Data: Run the selected in vitro assays and in silico models. Concurrently, compile all available historical in vivo toxicity data for the stressor and related chemicals.
- Perform Cross-Species Concordance Analysis: Assess the evolutionary conservation of the molecular target (e.g., receptor, enzyme) across taxa (fish, amphibians, invertebrates, algae). High conservation suggests broader taxonomic sensitivity.
- Integrated Data Analysis (Weight of Evidence): Combine all lines of evidence: AOP concordance, in vitro potency, in silico predictions, and existing in vivo data. Determine if the NAM data robustly identifies the most sensitive taxonomic group and predicts the critical effect.
- Decision Point: If the weight of evidence is strong, the assessment may proceed using the NAM-derived point of departure with a defined uncertainty factor. If significant uncertainty remains, targeted in vivo testing on the predicted most sensitive species is recommended, thereby focusing resources efficiently.
The Scientist's Toolkit: Essential Research Reagent Solutions
Table 3: Key Research Reagents and Materials for Resource-Conscious ERA
| Item / Solution | Primary Function in ERA | Application Context & Resource Advantage |
|---|---|---|
| HLB (Hydrophilic-Lipophilic Balanced) SPE Cartridges [26] | Broad-spectrum extraction of polar and non-polar organic contaminants from water samples. | Enables efficient monitoring of complex mixtures (e.g., pharmaceuticals in wastewater) with a single, robust extraction method, saving time and sample volume. |
| Certified Reference Standards | Provides accurate quantification and method validation during chemical analysis (e.g., HPLC-MS). | Essential for generating Tier 2/3 quality data. Investing in key standards for parent compounds and major metabolites improves data reliability, reducing uncertainty. |
| Ready-to-Use In Vitro Bioassay Kits (e.g., estrogen receptor transactivation) | Screens for specific mechanistic activity (e.g., endocrine disruption) in a high-throughput format. | A low-resource, rapid alternative to early-tier in vivo fish screening tests. Can prioritize which chemicals require full testing [23]. |
| QSAR Software & Databases (e.g., EPI Suite, OECD QSAR Toolbox) [26] | Predicts physicochemical properties, environmental fate, and baseline toxicity from molecular structure. | Provides critical Tier 1 data at virtually no cost for experimental testing. Fundamental for prioritization and screening assessments. |
| Cultured Test Organisms (e.g., Daphnia magna, algae clones) | Provides standardized, reliable organisms for acute and chronic toxicity testing. | Maintaining in-house cultures reduces cost and increases flexibility for Tier 2 testing compared to purchasing aged specimens for each assay. |
| Environmental DNA (eDNA) Sampling Kits | Allows for sensitive, non-invasive detection of species presence in field communities. | Can reduce the resource burden of traditional ecological surveys for baseline characterization or post-remediation monitoring. |
Structured Methodology: The Step-by-Step Process of Effective Problem Formulation
The initial phase of ecological risk assessment (ERA), problem formulation, is a critical planning and scoping exercise that determines the entire trajectory and relevance of the assessment [7]. Its primary purpose is to translate broad management goals into a specific, actionable analysis plan [2]. At the heart of this phase lies the essential task of integrating available information on three core elements: the characteristics of stressors, the structure and function of potentially exposed ecosystems, and the potential effects of the stressor on ecological entities [2]. This synthesis is not merely a data-collection step but a foundational analytical process that defines the assessment endpoints, informs the conceptual model, and determines the methodology for the subsequent analysis and risk characterization phases [4].
Effective integration ensures the ERA is focused, scientifically defensible, and capable of supporting environmental decision-making. A failure to adequately integrate this information can lead to assessments that are misdirected, overlook significant risks, or become mired in irrelevant detail, ultimately compromising their utility for risk managers [4]. This guide details the technical frameworks, data sources, and methodological approaches for systematically executing this integration within the problem formulation step.
Problem formulation is an interactive process where risk assessors and managers collaboratively define the scope based on available information [7]. The U.S. Environmental Protection Agency (EPA) outlines key information categories that must be integrated [2]:
- Stressor Characteristics: Source, magnitude, timing, frequency, and duration of the stressor (e.g., chemical properties, application rates of a pesticide, physical habitat alteration).
- Ecosystem Characteristics: The biotic and abiotic attributes of the potentially affected environment, including species composition, habitat types, and key ecosystem processes.
- Ecological Effects: Data on the toxicity or adverse impacts of the stressor on ecological entities, derived from laboratory studies, field observations, or models.
Information for integration originates from multiple lines of evidence. Registrant-submitted guideline studies are a primary source for chemical stressors [29]. Crucially, open literature from scientific journals provides a vital supplement, offering data on a wider range of species, field conditions, and novel endpoints [29]. Resources like the EPA's ECOTOX database are systematically searched to gather this literature, with studies screened for relevance and quality based on criteria such as explicit exposure duration, use of appropriate controls, and clear reporting of biological effects [29]. Furthermore, monitoring data and existing models (e.g., for chemical fate or population dynamics) provide critical context on exposure scenarios and ecosystem dynamics.
Frameworks for Structured Integration
Moving beyond data compilation, advanced frameworks structure the integration of stressors, ecosystems, and effects to enhance ecological realism.
The VORS Framework for Ecosystem Health: Recent research advances the "Vigor-Organization-Resilience-Stress" (VORS) model, which explicitly integrates ecosystem stress into health assessments [30]. This framework is operationalized through a composite Ecosystem Health Index (EHI), mathematically combining metrics representing:
- Vigor: Productivity and activity (e.g., Net Primary Productivity).
- Organization: Structure and complexity (e.g., landscape connectivity).
- Resilience: Capacity for recovery.
- Stress: External pressures (e.g., land use intensity, pollution load, fragmentation).
Integrating "Stress" as a core component ensures that the assessment of ecosystem state is directly informed by the magnitude of anthropogenic and natural pressures, providing a more diagnostic evaluation of risk [30].
Dynamic-Probabilistic Synthesis: For complex systems like shelf ecosystems, a synthesis of dynamic simulation models and probabilistic risk models has been proposed [31]. This approach integrates information by:
- Using a dynamic ecosystem model to simulate intra-annual variations in key components (e.g., phytoplankton, zooplankton, nutrient concentrations).
- Feeding these time-variant outputs into a probabilistic risk model, alongside observation data, to compute the likelihood of adverse effects from stressors like oil spills [31].
This method directly couples the natural dynamics of the ecosystem (its seasonal cycles and productivity) with stressor exposure, demonstrating that risk is not static but varies with ecological cycles [31].
Unified Environmental Scenarios: A pivotal concept for prospective ERA is the development of "unified environmental scenarios" that combine exposure and ecological parameters [32]. An exposure scenario predicts chemical fate in space and time using data on use patterns, chemical properties, and landscape configuration. An ecological scenario includes information on ecosystem structure, species traits, ecological interactions, and relevant abiotic factors [32]. Integrating these into a unified scenario ensures that exposure predictions and effects assessments are grounded in a consistent and realistic ecological context.
Quantitative Methods for Data Integration and Analysis
Bayesian Integration of Multiple Lines of Evidence: A powerful quantitative method for integrating disparate data types is Bayesian Markov Chain Monte Carlo (MCMC) [33]. This approach is used to combine multiple lines of evidence—such as risk assessments, biomonitoring data, and epidemiological studies—into a single, updated probability distribution for a risk metric (e.g., Risk Quotient, RQ). The process involves:
- Defining a prior probability distribution based on initial data or expert belief.
- Using MCMC sampling to update this prior with likelihood functions derived from new, disparate studies.
- Generating a posterior distribution that represents the integrated estimate of risk and its uncertainty [33].
This method allows risk assessors to quantitatively answer questions like, "What is the probability that the risk exceeds a level of concern, given all available evidence?" [33]
Table 1: Bayesian MCMC Integration of Multiple Evidence Lines for Insecticide Risk [33]
| Insecticide | Type of Studies Integrated | Mean Posterior Risk Quotient (RQ) | Variance | Probability (RQ > 1.0) |
|---|---|---|---|---|
| Malathion | Risk Assessments, Biomonitoring, Epidemiology | 0.4386 | 0.0163 | < 0.0001 |
| Permethrin | Risk Assessments, Biomonitoring, Epidemiology | 0.3281 | 0.0083 | < 0.0001 |
Dynamic Energy Budget (DEB) Modeling: At the organism-to-population level, DEB theory provides a mechanistic framework for integrating stressor effects with environmental conditions [32]. DEB models mathematically describe an organism's energy acquisition and allocation to maintenance, growth, and reproduction. The core integration step involves modeling how a toxicant alters these energy allocation rules. When coupled with Individual-Based Models (IBMs) to form DEB-IBMs, they can extrapolate individual-level effects—informed by both toxicant exposure and environmental factors like temperature and food availability—to population-level outcomes such as biomass or extinction risk [32]. This represents a deep integration of stressor mechanisms and ecosystem dynamics.
Table 2: Components of a DEB-IBM for Integrating Stressors and Environmental Factors [32]
| Model Component | Description | Role in Integration |
|---|---|---|
| DEB Core | Mathematical rules governing energy uptake from food, and allocation to maintenance, growth, reproduction, and maturation. | Provides the physiological baseline; toxicant effects are modeled as perturbations to these rules. |
| Toxicant Module | Links internal toxicant concentration to sub-lethal effects on DEB parameters (e.g., increased maintenance costs, reduced assimilation). | Integrates the chemical stressor's mechanism of action into the organism's life history. |
| Environmental Driver | Inputs for time-varying conditions like temperature, food density, and habitat quality. | Integrates key abiotic and biotic ecosystem factors that modulate energy intake and expenditure. |
| IBM Population Layer | Simulates a population of individual DEB organisms, each with unique traits and experiences, interacting in a space. | Scales integrated individual-level responses to predict ecological endpoints at the population level. |
Visualization and Communication of Integrated Information
Effective communication of integrated information is crucial. Beyond traditional conceptual model diagrams, advanced graphical tools are used.
Prevalence Plots: This method visualizes the output of integrated, probabilistic assessments [32]. A prevalence plot displays an effect size (e.g., percent reduction in population biomass) on the y-axis against its cumulative prevalence (e.g., proportion of water bodies affected) on the x-axis. The curve is generated by running many model simulations (e.g., a DEB-IBM) across a range of realistic environmental scenarios and exposure levels. This single figure communicates both the severity and the spatial (or temporal) frequency of potential effects, offering a more informative and risk-based perspective than a simple PEC/PNEC ratio [32].
Conceptual Model Diagrams: A cornerstone of problem formulation is the development of a conceptual model diagram [2]. This visual tool integrates knowledge by illustrating hypothesized relationships between stressors, exposure pathways, ecosystem components, and assessment endpoints. It serves to identify key data gaps, prioritize analysis, and ensure a shared understanding among the assessment team.
Integrated Analysis Workflow: The following diagram synthesizes the major steps and iterative feedback involved in integrating information during problem formulation.
Table 3: Key Research Reagents and Resources for Information Integration in Problem Formulation
| Tool / Resource | Primary Function | Application in Integration |
|---|---|---|
| ECOTOX Database | A curated, publicly available database summarizing single-chemical toxicity test results for aquatic and terrestrial species [29]. | The primary source for sourcing and screening open literature effects data to complement guideline studies [29]. |
| Dynamic Energy Budget (DEB) Toolbox | A suite of software tools and libraries for constructing DEB models. | Provides the mechanistic framework to integrate toxicant effects with environmental drivers on organism physiology [32]. |
| Bayesian MCMC Software (e.g., JAGS, Stan) | Software platforms for performing Bayesian analysis using Markov Chain Monte Carlo sampling. | Enables the quantitative integration of disparate lines of evidence into a unified probabilistic risk estimate [33]. |
| Geographic Information System (GIS) | Software for capturing, managing, analyzing, and presenting spatial data. | Integrates spatial data on stressor sources, land use, habitat types, and species distributions to define exposure scenarios and ecosystem boundaries. |
| Unified Environmental Scenario Templates | Standardized, region-specific descriptions of environmental parameters (hydrology, climate, land use, species lists). | Provides a consistent ecological context for both exposure and effects modeling, ensuring they are realistically coupled [32]. |
The selection of assessment endpoints represents the critical bridge between scientific investigation and environmental decision-making within the ecological risk assessment (ERA) process. This step, embedded in the problem formulation phase, translates broad management goals into specific, measurable entities that direct the entire technical assessment [2] [7]. For a thesis focused on advancing problem formulation methodologies, this step is where abstract regulatory concerns are operationalized into testable scientific hypotheses. Effective endpoint selection ensures that the subsequent analysis and risk characterization address questions that are both ecologically significant and policy-relevant, thereby maximizing the utility of the risk assessment for risk managers and stakeholders [34] [2]. This guide details the technical principles, protocols, and decision frameworks for selecting endpoints that are defensible, actionable, and integral to a robust problem formulation strategy.
Foundational Principles: The Role of Assessment Endpoints in Problem Formulation
Assessment endpoints are explicit expressions of the environmental values to be protected, derived from management goals established during the planning dialogue between risk assessors and risk managers [2]. They consist of two mandatory elements: 1) the ecological entity (e.g., a species, functional group, community, or ecosystem process), and 2) the specific attribute of that entity worthy of protection (e.g., survival, reproduction, biodiversity, nutrient cycling) [2].
Within the problem formulation framework, assessment endpoints serve multiple essential functions [2] [7]:
- Directing the Scope of the Assessment: They set the spatial, temporal, and biological boundaries for the investigation.
- Guiding Conceptual Model Development: They are the final receptors in the cause-effect pathways illustrated in conceptual models, which link stressors to potential effects.
- Informing the Analysis Plan: They determine what measures of exposure and effect (known as measurement endpoints) are necessary for the analysis phase.
- Connecting Science to Policy: By aligning with societal values and management goals, they ensure the assessment's conclusions support actionable decisions.
A Systematic Protocol for Endpoint Selection
The following step-by-step protocol operationalizes the endpoint selection process within a problem formulation workflow.
Step 1: Elicit and Analyze Management Goals & Regulatory Context Begin by reviewing the formal planning summary, which documents agreements on management goals, regulatory actions, and the scope of the assessment [2]. Interview risk managers and stakeholders to understand the core ecological values of concern. For example, a goal may be "maintaining a sustainable aquatic community" under the Clean Water Act [2].
Step 2: Identify Potential Ecological Entities List the species, habitats, or ecosystem processes that embody the management goals. Consider entities at multiple levels of biological organization (e.g., endangered species, keystone species, critical habitat types, essential nutrient cycles).
Step 3: Identify Protectable Attributes for Each Entity For each ecological entity, identify the specific attribute whose impairment would constitute an unacceptable adverse effect. Common attributes include survival, growth, reproduction (for species), species richness and composition (for communities), and primary productivity or decomposition rates (for ecosystem functions).
Step 4: Apply Selection Criteria for Scientific Defensibility Evaluate each candidate "Entity-Attribute" pair against the following criteria [2] [7]:
- Susceptibility to the Stressor: Is the entity likely to be exposed and sensitive to the stressor (e.g., a specific pesticide)?
- Relevance to Ecosystem Structure/Function: Does the attribute play a key role in maintaining the ecosystem? Impairment should signal broader ecological consequences.
- Availability of Measurement Endpoints: Can the attribute be quantified or estimated using available or obtainable tools (e.g., toxicity tests, population models, field surveys)?
- Unambiguous Interpretation: Can changes in the measured response be clearly linked to stressor exposure and ecological effect?
Step 5: Apply Selection Criteria for Policy Relevance Evaluate the remaining candidates against policy-driven criteria [34]:
- Linkage to Societal Values & Ecosystem Services: Does the endpoint represent a service with value to society (e.g., crop pollination, water purification, carbon sequestration) [34]?
- Regulatory and Statutory Relevance: Is the entity or attribute explicitly protected by law (e.g., Endangered Species Act, Clean Water Act) [2]?
- Importance to Stakeholders: Is the endpoint recognized as valuable by the public or specific stakeholder groups?
Step 6: Finalize and Document Endpoint Selection Select the final set of assessment endpoints that best satisfy both scientific and policy criteria. Document the rationale for selection and for the exclusion of other potential endpoints. These finalized endpoints now anchor the development of the conceptual model and the analysis plan [2].
Table 1: Evaluation of Candidate Assessment Endpoints for a Pesticide Risk Assessment
| Ecological Entity | Protectable Attribute | Scientific Defensibility (Susceptibility/Measurability) | Policy Relevance (Ecosystem Service/Regulatory Link) | Selection Priority |
|---|---|---|---|---|
| Fathead Minnow (Pimephales promelas) | Reproductive success (fecundity) | High: Standard test species; chronic toxicity data available [2]. | Medium: Supports fishery resources; indicator of aquatic community health. | High (Measurable Surrogate) |
| Colonization Rate of Leaf Litter by Microbes | Decomposition rate | Medium: Can be measured in mesocosms; sensitive to toxicants. | High: Directly linked to nutrient cycling ecosystem service [34]. | Medium (Process-Based) |
| Adult Bald Eagle (Haliaeetus leucocephalus) | Adult survival | Low: Difficult to measure directly; exposure pathway complex. | Very High: Protected under Bald and Golden Eagle Protection Act; high societal value. | High (Requires Modeling) |
| Soil Arthropod Diversity | Species richness & evenness | Medium: Can be measured but taxonomically intensive; response is integrative. | Medium: Supports soil formation service [34]. | Low (Secondary Endpoint) |
Expanding Endpoint Selection to Incorporate Ecosystem Services
A contemporary advancement in problem formulation is the explicit incorporation of ecosystem services as assessment endpoints [34]. This approach directly links ecological risk to human well-being, making assessments more relevant for cost-benefit analyses and stakeholder communication [34].
Table 2: Linking Traditional Ecological Entities to Ecosystem Service Endpoints
| Ecosystem Service Category | Example Service | Related Ecological Entity & Attribute | Potential Measurement Endpoint |
|---|---|---|---|
| Provisioning | Sustainable fisheries | Fish population → reproductive rate | Juvenile fish growth and survival |
| Regulating | Water purification | Riparian wetland plant community → nutrient uptake capacity | Nitrate removal rate in soil cores |
| Supporting | Soil formation & fertility | Soil invertebrate community → biomass & diversity | Litter decomposition rate; earthworm abundance [34] |
| Cultural | Recreational birdwatching | Bird community → species diversity & abundance | Point count surveys of key species |
Experimental & Methodological Guidance for Endpoint Analysis
The selection of assessment endpoints directly informs the experimental and analytical methods required in the subsequent Analysis phase of ERA [7].
5.1. Exposure Assessment Protocols Exposure profiles must be developed for each selected endpoint entity.
- For Chemical Stressors: Use empirical data (e.g., monitoring of pesticide concentrations in water [2]) or model estimates (e.g., EPA's PRZM/EXAMS models) to derive an Estimated Environmental Concentration (EEC) relevant to the entity's habitat [2].
- For Biological Stressors (e.g., invasive species): Quantify pressure metrics such as population density of the invader, rate of spatial spread, or hybridization frequency with native species.
- Key Protocol: Standardized water column and sediment sampling methods (EPA Method 1669) for chemical monitoring; geographic information system (GIS) tracking and population surveys for invasive species.
5.2. Effects Assessment Protocols Effects data quantify the relationship between stressor magnitude and the endpoint attribute's response.
- Toxicity Testing: For standard test species (e.g., laboratory rat for mammals, rainbow trout for fish), analyze data from guideline-accepted acute (e.g., LC50) and chronic (e.g., NOAEC - No Observed Adverse Effect Concentration) studies [2].
- Modeled or Extrapolated Effects: For non-standard species or ecosystem attributes, use tools like Species Sensitivity Distributions (SSD) or process-based models (e.g., ecosystem nutrient cycling models).
- Field Observational Studies: Conduct systematic surveys (e.g., benthic macroinvertebrate community sampling) to measure effects attributes in the field, comparing stressed and reference sites [7].
- Key Protocol: Follow OECD or EPA test guidelines (e.g., OPPTS 850.1075 for fish acute toxicity). For SSDs, follow the EPA's protocol for deriving a chronic criterion concentration using a minimum of 8 species from 8 different families.
Table 3: Key Research Reagent Solutions and Tools for Assessment Endpoint Analysis
| Tool/Reagent Category | Specific Example | Function in Endpoint Analysis |
|---|---|---|
| Surrogate Test Organisms | Fathead minnow (Pimephales promelas), cladoceran (Daphnia magna), earthworm (Eisenia fetida) | Standardized biological units for generating toxicity effects data on survival, growth, and reproduction for aquatic and terrestrial animal assessment endpoints [2]. |
| Toxicity Benchmarks | Acute LC50/EC50, Chronic NOAEC/LOAEC, MATC (Maximum Acceptable Toxicant Concentration) | Quantitative values derived from toxicity tests that serve as critical measurement endpoints for comparison with exposure estimates during risk characterization [2]. |
| Exposure Simulation Models | PRZM (Pesticide Root Zone Model), EXAMS (Exposure Analysis Modeling System), AERMOD (Atmospheric Dispersion Model) | Software tools used to predict the environmental fate and transport of stressors (e.g., chemicals) and generate estimated exposure concentrations (EECs) for ecological entities [2]. |
| Ecological Network Analysis (ENA) Software | Tools implementing Graph Theory (e.g., Cytoscape, Graphab) | Used to model and analyze relationships (links) between ecological entities (nodes), such as food webs or habitat connectivity, to assess risks to complex, network-based endpoints [35]. |
| Ecosystem Service Valuation Databases | InVEST (Integrated Valuation of Ecosystem Services and Tradeoffs) model suite, ARIES (Artificial Intelligence for Ecosystem Services) | Model platforms that use spatial data to quantify and map ecosystem services (e.g., carbon storage, water yield), aiding in the selection and valuation of service-based assessment endpoints [34]. |
Visualizing the Process: From Goals to Endpoints
The following diagram illustrates the logical workflow and decision points for selecting assessment endpoints within the problem formulation phase, integrating inputs from management, ecology, and policy.
Diagram: Workflow for Selecting Assessment Endpoints in Problem Formulation. This diagram outlines the systematic progression from planning inputs to final endpoint selection, highlighting the sequential application of scientific and policy filters [2] [7].
The deliberate and transparent selection of scientifically defensible and policy-relevant assessment endpoints is the cornerstone of a credible and useful ecological risk assessment. It is a highly iterative and analytical process central to problem formulation, requiring continuous dialogue between risk assessors and managers [2]. By rigorously applying the dual criteria of scientific plausibility and societal relevance—and by embracing frameworks like ecosystem services—assessors can ensure their work effectively diagnoses ecological risks and informs sustainable management decisions. This step transforms the abstract aims of environmental protection into a concrete, actionable research plan, ultimately determining the assessment's scientific validity and practical impact [34] [7].
Within the systematic framework of ecological risk assessment (ERA), problem formulation establishes the purpose, scope, and focus of the assessment [12]. The pivotal third step in this phase is the development of a conceptual model, a graphic and narrative representation that articulates predicted relationships between ecological entities and potential stressors [36] [12]. This guide details the technical construction of conceptual models, integrating risk hypotheses and visual diagrams to create a foundational blueprint for analysis.
The Role of Conceptual Models in Problem Formulation
A conceptual model translates the broad objectives from the planning phase into a structured analytical plan [12]. It serves as a visual hypothesis of how the system functions and how a stressor might adversely affect it. The model specifies the stressor sources, the ecological receptors of concern, the pathways through which receptors are exposed, and the potential effects on assessment endpoints [36] [12].
This process forces explicit articulation of risk hypotheses—testable statements about the expected nature and magnitude of effects. Developing the model integrates available information, reveals critical data gaps, and ensures all stakeholders share a common understanding of the assessment's logic before committing to resource-intensive analysis [12].
Core Components and Construction Methodology
Constructing a robust conceptual model involves the iterative definition of its core elements, informed by available data and stakeholder input.
Defining Core Elements
The model is built upon several interlinked components [36] [12]:
- Stressor Source & Characteristics: The origin (e.g., pesticide application, effluent discharge) and properties of the stressor (e.g., parent compound, major degradates, physicochemical properties).
- Exposure Pathways: The physical routes a stressor takes from source to receptor (e.g., runoff, spray drift, groundwater leaching, trophic transfer).
- Ecological Receptors: The species, communities, or ecosystems potentially exposed, with special attention to endangered species or critical habitats [36].
- Assessment Endpoints: Explicit expressions of the specific ecological values to be protected, combining the valued receptor and the attribute of concern (e.g., survival of juvenile fathead minnows, reproductive success of honeybee colonies) [12].
- Measurement Endpoints: The measurable responses (e.g., LC50, growth rate) used to evaluate effects on the assessment endpoint.
- Risk Hypotheses: Testable predictions linking exposure via specific pathways to effects on measurement and assessment endpoints.
Quantitative Criteria for Pathway Inclusion
Not all potential pathways are equally significant. The U.S. Environmental Fate and Effects Division (EFED) provides criteria for evaluating the relevance of specific exposure pathways, ensuring models are tailored and realistic [36].
Table 1: Criteria for Including Specific Exposure Pathways in Conceptual Models
| Exposure Pathway | Inclusion Criteria | Key Quantitative Triggers |
|---|---|---|
| Sediment Exposure (Aquatic) | Consider if pesticide/degradate is persistent and partitions to sediment [36]. | Half-life in sediment ≥ 10 days AND (Kd ≥ 50 L/kg, log Kow ≥ 3, or Koc ≥ 1,000 L/kg OC) [36]. |
| Groundwater Exposure | Consider if pesticide/degradate is mobile and persistent or monitoring data show detection [36]. | Monitoring detects residues; OR Field dissipation shows leaching; OR Kd < 5 AND hydrolysis half-life > 30 days or soil metabolism half-life > 2 weeks [36]. |
| Atmospheric Transport | Consider for semi-volatile compounds; requires evaluation of volatilization potential [36]. | Assessment of vapor pressure, Henry's Law constant, and use of tools like the Screening Tool for Inhalation Risk (STIR) [36]. |
| Trophic Transfer (to piscivorous birds/mammals) | Consider for bioaccumulative, hydrophobic organic pesticides [36]. | Pesticide is non-ionic, organic, AND log Kow is between 4 and 8, AND potential to reach aquatic habitats [36]. |
Development Protocol
The following protocol provides a step-by-step methodology for model development:
- Assemble Information: Compile all available data on the stressor (fate, transport, toxicity), the ecosystem (habitat maps, species inventories, water flow), and potential exposure scenarios.
- Draft Preliminary Diagram: Create a initial diagram linking sources to receptors via all plausible pathways. Use generic models (e.g., EPA's aquatic or terrestrial templates) as a starting point [36].
- Conduct Stakeholder Review: Present the draft to risk managers, subject matter experts, and other stakeholders to validate logic, identify missing elements, and refine risk hypotheses.
- Apply Pathway Criteria: Systematically evaluate each exposure pathway using criteria like those in Table 1 to justify its inclusion (solid line) or exclusion (dotted/removed line) in the final model [36].
- Finalize Model and Analysis Plan: Produce the final conceptual model diagram accompanied by a narrative. Derive a detailed analysis plan that specifies the data needed, methods for exposure and effects analysis, and approaches for testing each risk hypothesis [12].
Visualization Standards and Diagrammatic Representation
Effective visual communication is essential. Diagrams must be clear, logically consistent, and accessible.
Visual Grammar and Conventions
A standardized visual grammar ensures immediate comprehension [36]:
- Boxes/Rectangles: Represent entities (sources, stressors, receptors, endpoints).
- Arrows/Lines: Represent relationships, flows, or exposure pathways. A solid line indicates a pathway included for formal analysis; a dotted line indicates a pathway considered but excluded from quantitative analysis [36].
- Color: Use color purposefully to categorize elements (e.g., stressor, pathway, receptor, effect). Adhere strictly to contrast requirements.
- Hierarchy/Layout: Position the stressor source at the top or center. Arrange pathways and receptors to minimize line crossing and show flow direction clearly.
Accessibility & Color Contrast Compliance
Diagrams must be legible for all users, complying with WCAG 2.1 AA standards [37] [38].
- Text Contrast: The contrast ratio between text color (
fontcolor) and its background color (fillcolor) must be at least 4.5:1 for standard text [37] [38]. - Large Text Contrast: For "large scale" text (approximately 18pt or 14pt bold), the minimum ratio is 3:1 [38].
- Color Palette: The following accessible palette meets these standards when paired appropriately (e.g., dark text on light backgrounds or vice versa):
#4285F4,#EA4335,#FBBC05,#34A853,#FFFFFF,#F1F3F4,#202124,#5F6368.
Diagram Generation with Graphviz (DOT)
Graphviz's DOT language provides a reproducible, programmatic method for generating professional diagrams. Below is a script for a generic aquatic exposure conceptual model, incorporating accessibility rules.
Graph Title: Generic Aquatic Exposure Conceptual Model
Table 2: Research Reagent Solutions for Conceptual Model Development
| Tool/Component | Function in Model Development | Application Notes |
|---|---|---|
| Generic Model Templates (EPA) [36] | PowerPoint files providing standardized starting points for aquatic and terrestrial systems. | Must be modified to reflect specific stressors, degradates, and site conditions [36]. |
| Partitioning Coefficients (Kd, Kow, Koc) [36] | Quantitative parameters used to evaluate the significance of sediment and trophic transfer exposure pathways. | Key triggers for pathway inclusion (see Table 1). Determined from laboratory studies [36]. |
| Environmental Fate Data (Half-lives, vapor pressure) [36] | Used to evaluate the persistence and mobility of the stressor, informing ground water and atmospheric pathway inclusion. | From aerobic soil metabolism, aquatic metabolism, and hydrolysis studies [36]. |
| KABAM (Kow-based Aquatic BioAccumulation Model) [36] | A simulation model used to estimate bioaccumulation in aquatic food webs for hydrophobic organic pesticides. | Applied when log Kow is between 4-8 to assess risks to piscivorous birds and mammals [36]. |
| Screening Tool for Inhalation Risk (STIR) [36] | A screening-level model to assess potential acute inhalation exposure risk from airborne droplets and vapor. | Used to determine if the atmospheric transport/inhalation pathway requires detailed analysis [36]. |
Advanced Approaches: From Simple Chains to Impact Webs
While linear, pathway-driven models are effective for single-stressor assessments, contemporary challenges require more sophisticated tools to model complex risks characterized by feedback loops, cascading effects, and multi-hazard interactions [39].
The Impact Webs methodology represents a significant advance in conceptual modeling [39]. Developed to characterize complex risks (e.g., compounding effects of COVID-19 and climate hazards), it moves beyond linear chains to map interconnections between hazards, systemic vulnerabilities, root causes, response actions, and cascading impacts across sectors [39]. Its participatory development with stakeholders helps uncover critical system interactions and evaluate trade-offs of management decisions [39].
Table 3: Evolution of Conceptual Model Types for Ecological Risk
| Model Type | Structure | Best Use Case | Visualization Example |
|---|---|---|---|
| Linear Pathway Model [36] | Sequential, source-to-receptor pathways. | Standard ERA for a defined chemical stressor. | Flowchart/Directed graph. |
| Causal Loop Diagram | Networks with reinforcing/balancing feedback loops. | Systems where stressors affect interacting ecosystem components. | Circular nodes with signed arrows. |
| Bayesian Belief Network | Probabilistic graphs representing causal relationships. | Data-rich environments requiring quantitative uncertainty analysis. | Directed acyclic graph with conditional probability tables. |
| Impact Web [39] | Web-like network mapping multi-scale drivers, hazards, exposures, vulnerabilities, and impacts. | Complex, multi-hazard scenarios with cascading effects across sectors (e.g., pandemic + extreme weather). | Multi-layered, hierarchical network diagram. |
Below is a simplified DOT representation of an Impact Web core logic, illustrating its multi-layered, systemic nature.
Graph Title: Core Logic of an Impact Web for Complex Risk
The development of a conceptual model with explicit risk hypotheses and clear visual diagrams is a critical, iterative step that bridges the planning and analysis phases of ecological risk assessment. By following a structured protocol—defining elements, applying quantitative criteria for pathway inclusion, and adhering to visual accessibility standards—risk assessors create a transparent and scientifically defensible blueprint. While traditional linear models remain vital for many applications, emerging methodologies like Impact Webs offer a necessary evolution in conceptual modeling, providing the tools to diagram and hypothesize about the complex, interconnected risks that define contemporary environmental challenges [39]. The resulting model is not merely a diagram but the foundational hypothesis of the entire risk assessment, guiding all subsequent data collection, analysis, and interpretation.
Within the formal process of ecological risk assessment (ERA), the development of a rigorous analysis plan is the critical, concluding step of the problem formulation phase [7]. This plan serves as the strategic blueprint that transitions the assessment from conceptual understanding to actionable science. It operationalizes the agreements reached during planning—such as management goals, regulatory context, and assessment scope—into a concrete design for data evaluation and risk estimation [12] [2].
The analysis plan's primary function is to explicitly detail how the risk hypotheses, articulated in the conceptual model, will be tested. It specifies the measurement endpoints (the empirical data to be collected or analyzed), links them to the assessment endpoints (the ecological values to be protected), and delineates the exact methods, models, and data required to characterize exposure and effects [2] [40]. This stage ensures scientific defensibility, manages resource allocation, and directly addresses uncertainties that were identified during problem formulation [12]. For researchers, a well-constructed analysis plan is indispensable for generating evidence that is both ecologically relevant and decision-relevant, thereby bridging the gap between scientific investigation and environmental management.
Core Components of the Analysis Plan
The analysis plan is built upon the outputs of the earlier stages of problem formulation. Its architecture consists of several interconnected components.
Articulating Risk Hypotheses and the Conceptual Model
The foundation of the analysis plan is a set of clear risk hypotheses. These are statements that predict causal relationships between a stressor, an exposure pathway, and an adverse effect on an assessment endpoint [2]. For example, a hypothesis might state: "Runoff of pesticide X into aquatic system Y will result in concentrations sufficient to reduce the survival and reproduction of species Z, leading to a decline in its local population."
These hypotheses are best communicated through a conceptual model diagram, a visual schematic that maps the relationships between sources, stressors, exposure pathways, ecological receptors, and potential effects [12]. This model identifies the key variables and processes that must be analyzed.
Diagram: Conceptual Model for a Pesticide ERA
Defining Assessment Endpoints and Measurement Endpoints
A central task of the analysis plan is to formalize the link between ecological protection goals and measurable data.
Assessment Endpoints: These are explicit expressions of the ecological values to be protected, defined by an ecological entity (e.g., a species, functional group, community, or ecosystem) and a valued attribute of that entity (e.g., survival, reproduction, biodiversity, ecosystem function) [12] [2]. They are derived from societal and management goals. Example: "Sustainable reproductive success of the fathead minnow (Pimephales promelas) population in River A."
Measurement Endpoints: These are quantifiable measures of a stressor, exposure, or ecological response that are used to evaluate the status of an assessment endpoint [40]. They are the actual data points collected from experiments, models, or monitoring. Example: "The 96-hour LC₅₀ (median lethal concentration) for fathead minnow in laboratory toxicity tests," or "the in-stream concentration of pesticide X."
The relationship between these endpoints is not always direct. A core challenge in ERA is the frequent mismatch between what is easily measured (often in laboratory studies on individual organisms) and the ultimate assessment endpoint of concern (often populations, communities, or ecosystem services) [40]. The analysis plan must justify the extrapolation from measurement to assessment endpoint.
Table 1: Relationship Between Assessment Endpoints and Measurement Endpoints
| Assessment Endpoint (Ecological Value to Protect) | Possible Measurement Endpoints (Quantifiable Data) | Level of Biological Organization |
|---|---|---|
| Population sustainability of a fish species | Individual survival (LC₅₀), individual reproduction (NOEC/LOEC), population growth rate model output | Individual → Population |
| Integrity of aquatic invertebrate community | Single-species toxicity data (EC₅₀ for Daphnia), species sensitivity distribution (SSD), field mesocosm study of species richness | Individual → Community |
| Ecosystem service of water purification | Microbial activity assays, nutrient cycling rates, decomposition studies | Organismal → Ecosystem Function |
| Viability of an endangered pollinator | Adult insect mortality, larval development success, foraging behavior assays | Individual |
Selecting the Assessment Design: Tiered Approaches
The analysis plan must specify the overall assessment design. A common and resource-efficient framework is the tiered approach [12] [40]. Lower tiers use conservative assumptions and simple models to screen for potential risks. If risks are indicated, higher tiers employ more complex, realistic, and often site-specific analyses to refine the risk estimate.
Table 2: Tiered Ecological Risk Assessment Approach [40]
| Tier | Description | Risk Metric & Methods | Data Needs & Typical Output |
|---|---|---|---|
| Tier I: Screening | Conservative analysis to screen out scenarios with "no reasonable potential for risk." Uses worst-case exposure estimates and standard toxicity values. | Risk Quotient (RQ): Ratio of Estimated Exposure Concentration (EEC) to Toxicity Value (e.g., LC₅₀, NOAEC). Compared to a Level of Concern (LOC). | Standard laboratory toxicity data, conservative fate/transport model outputs (e.g., T-REX, TerrPlant) [41]. Output: Pass/Fail against LOC. |
| Tier II: Refined | Incorporates more realistic exposure scenarios and species sensitivity. Begins to account for variability and uncertainty. | Probabilistic Risk Estimation: e.g., comparing exposure distributions to toxicity reference distributions. May use Species Sensitivity Distributions (SSDs). | Refined exposure modeling (e.g., KABAM for bioaccumulation) [41], expanded toxicity dataset for SSDs. Output: Risk probability distributions. |
| Tier III: Advanced Refined | High-resolution, often spatially explicit analysis. Explores influence of parameter uncertainty on predictions. | Complex mechanistic models (e.g., individual-based population models, ecosystem models). | Site-specific monitoring data, detailed life-history parameters, habitat maps. Output: Model-predicted impacts on assessment endpoints. |
| Tier IV: Site-Specific | Direct measurement of effects under real-world conditions. | Field Studies & Monitoring: Mesocosm experiments, in-situ biological surveys, community metrics. | Empirical field data on exposed populations/communities, chemical monitoring in multiple media. Output: Multiple lines of evidence for cause-effect. |
The plan must explicitly list all required data, its required quality, and its sources.
- Exposure Assessment Data: Needs include stressor characteristics (e.g., application rate, chemical properties), environmental fate and transport parameters, and data on receptor behavior (e.g., home range, diet). Sources include chemical manufacturers, environmental fate databases (e.g., ECOTOX) [41], and exposure models.
- Effects Assessment Data: Needs include toxicity data (acute and chronic endpoints) for relevant species, data on sublethal effects, and information on recovery potential. Key sources are standardized guideline studies, the open literature, and specialized databases like the EPA's ECOTOX Knowledgebase [41].
- Ecosystem Characterization Data: For higher-tier assessments, data on the specific ecosystem is required (e.g., hydrology, soil type, land use, species present, community structure). Sources include field surveys, geographic information systems (GIS), and resources like EnviroAtlas [41].
Methodologies and Protocols for Key Analyses
The analysis plan must detail the methodologies for generating or analyzing critical data.
Standardized Aquatic Toxicity Testing
Purpose: To generate measurement endpoints (e.g., LC₅₀, NOEC) for assessing the intrinsic hazard of a chemical to aquatic life [2] [40]. Protocol Overview:
- Test Organisms: Select standardized, sensitive surrogate species (e.g., fathead minnow (Pimephales promelas) for fish, water flea (Daphnia magna) for invertebrates, green alga (Pseudokirchneriella subcapitata) for plants).
- Exposure System: Prepare a dilution series of the test chemical in reconstituted water within static, renewal, or flow-through chambers. Maintain constant temperature, photoperiod, and water quality (pH, dissolved oxygen, hardness).
- Test Design: Include a minimum of five concentrations plus a negative control. Use replicate vessels per concentration. For acute tests (e.g., 48-96 hours), primary endpoint is mortality. For chronic tests (e.g., 7-42 days), endpoints include survival, growth, and reproduction.
- Quality Control: Test must meet validity criteria (e.g., control survival ≥90%, water quality within specified ranges). Use reference toxicants to confirm organism sensitivity.
- Data Analysis: Use statistical methods (e.g., probit analysis, Spearman-Karber) to calculate LC₅₀/EC₅₀ values. Use ANOVA or regression to determine No Observed Effect Concentration (NOEC) and Lowest Observed Effect Concentration (LOEC).
Species Sensitivity Distribution (SSD) Development
Purpose: To estimate the concentration of a stressor that is protective of a specified percentage of species in a community (e.g., the HC₅, hazardous concentration for 5% of species) [41]. Protocol Overview:
- Data Collection: Compile a set of chronic NOEC values (or equivalent) from high-quality toxicity tests for a wide range of species (preferably >10) from different taxonomic groups (fish, invertebrates, plants, algae).
- Distribution Fitting: Fit a statistical distribution (e.g., log-normal, log-logistic) to the ranked toxicity data. Plot cumulative probability against log-transformed effect concentration.
- Derivation of Protective Values: Calculate the HC₅ and its associated confidence limits from the fitted distribution (e.g., using the 5th percentile).
- Uncertainty Analysis: Assess uncertainty through bootstrapping methods to generate confidence intervals around the HC₅, acknowledging the limitations of the dataset.
Field Mesocosm Study
Purpose: To evaluate community- and ecosystem-level effects under more realistic, semi-controlled conditions [40]. Protocol Overview:
- System Design: Establish outdoor experimental ponds, streams, or soil plots that replicate key features of the natural ecosystem. Colonize them with a natural assemblage of organisms (phytoplankton, zooplankton, macroinvertebrates, plants).
- Treatment Application: Apply the stressor (e.g., pesticide) to replicate mesocosms at a range of environmentally relevant concentrations, including untreated controls.
- Monitoring: Sample repeatedly over time (weeks to months) for chemical concentrations, structural endpoints (species abundance, diversity, biomass), and functional endpoints (primary production, decomposition, nutrient cycling).
- Statistical Analysis: Use multivariate statistics (e.g., Principal Response Curves) to analyze community trajectories and determine the No Observed Effect Concentration (NOECcommunity) for the most sensitive ecological endpoints.
Table 3: Key Research Reagent Solutions and Tools for ERA
| Tool / Resource | Function in Analysis | Example / Source |
|---|---|---|
| ECOTOX Knowledgebase | A curated database providing single-chemical toxicity data for aquatic and terrestrial life. Used to compile effects data for hazard assessment and SSD development. | U.S. EPA ECOTOX [41] |
| T-REX & TerrPlant Models | Screening-level models that estimate exposure of terrestrial animals and plants to pesticides in soil. Used in Tier I assessments to calculate Risk Quotients. | U.S. EPA Models [41] |
| KABAM Model | A simulation model used to estimate bioaccumulation of chemicals in freshwater aquatic food webs. Key for assessing exposure through the diet for higher trophic levels. | Kow (based) Aquatic BioAccumulation Model [41] |
| Species Sensitivity Distribution (SSD) Tools | Software and guidance for fitting distributions to toxicity data and deriving community-level protective concentrations (e.g., HC₅). | U.S. EPA SSD Resources [41] |
| Standard Test Organisms | Live cultures of surrogate species required for regulatory toxicity testing. Provide consistent, sensitive biological reagents. | e.g., Ceriodaphnia dubia (cladoceran), Chironomus dilutus (midge). |
| EnviroAtlas | Provides geospatial data, tools, and resources related to ecosystem services, biodiversity, and landscape condition. Used for ecosystem characterization and contextualizing risk. | U.S. EPA EnviroAtlas [41] |
| Water Quality Criteria & Benchmarks | Provide regulatory or guidance values for chemical concentrations in water intended to protect aquatic life. Used as comparative benchmarks in risk characterization. | U.S. EPA National Recommended Water Quality Criteria [41] |
Diagram: Analysis Plan Development Workflow
The final analysis plan is a cohesive document that binds together the conceptual model, testable hypotheses, a justified tiered approach, and a complete inventory of required data and methods. It explicitly addresses how uncertainties in extrapolation (e.g., from laboratory to field, from individuals to populations) will be handled, whether through application of assessment factors, probabilistic modeling, or direct higher-tier testing [40]. By meticulously mapping the journey from measurable endpoints to the data needed to inform them, the analysis plan transforms the problem formulation from a theoretical exercise into a robust, actionable scientific protocol. It ensures that the subsequent Analysis phase is efficient, targeted, and ultimately capable of producing a Risk Characterization that clearly communicates the likelihood and severity of adverse ecological effects to decision-makers [7] [12].
Problem formulation is the foundational and arguably most critical phase of ecological risk assessment (ERA), serving as the essential bridge between regulatory goals and scientific analysis. Within the broader thesis of ecological risk assessment research, problem formulation represents the structured process of defining the nature, scope, and boundaries of an assessment, ensuring that subsequent analytical efforts are relevant, efficient, and ultimately actionable for risk managers [2]. For researchers, scientists, and drug development professionals, a rigorous problem formulation phase is indispensable for designing studies that yield defensible data for regulatory decision-making, whether for new pesticide approvals, the review of existing chemicals, or the remediation of contaminated sites [42].
The process is inherently collaborative and iterative, involving continuous dialogue between risk assessors, risk managers, and stakeholders [12]. Its primary output is a clear roadmap—comprising assessment endpoints, a conceptual model, and an analysis plan—that guides the entire assessment. In the context of pesticides and contaminated sites, this phase must account for complex variables including the chemical and physical properties of stressors, their environmental fate and transport, the specific ecosystems and receptors at risk, and the multiple potential exposure pathways [2]. A well-executed problem formulation ensures that the assessment focuses on plausible and significant risks, avoids unnecessary data collection, and explicitly identifies uncertainties, thereby conserving scientific resources and enhancing the credibility of the final risk characterization [12].
Core Components of Problem Formulation
The problem formulation phase integrates several key tasks, each building upon the agreements reached during initial planning and scoping with risk managers [2].
Planning and Scoping Dialogue
Before problem formulation begins, a planning dialogue establishes the framework. Risk managers define the regulatory action (e.g., new pesticide registration, Superfund site remediation) and articulate high-level management goals, such as "preventing toxic contamination in water" or "maintaining a sustainable aquatic community" [2]. Together, risk managers and assessors agree on the assessment's scope, complexity, and available resources, often adopting a tiered approach that starts with conservative screening-level assessments before proceeding to more complex, resource-intensive evaluations if needed [12].
Assessment Endpoints and Conceptual Model Development
The core of problem formulation is the selection of assessment endpoints and the development of a conceptual model.
- Assessment Endpoints: These are explicit translations of management goals into measurable ecological entities and their attributes. An endpoint consists of both the valued entity (e.g., the fathead minnow population, a soil invertebrate community, an endangered plant species) and the specific attribute of concern (e.g., survival, reproduction, community structure) [12]. Selection criteria include ecological relevance, susceptibility to the stressor, and relevance to management and societal values [2].
- Conceptual Model: This is a visual and narrative representation of the hypothesized relationships between stressors and assessment endpoints. It diagrams the source of the stressor, its release mechanisms, environmental transport and fate pathways, the locations and means of exposure for ecological receptors, and the anticipated ecological effects [43]. The model identifies data gaps and ranks components by uncertainty, forming the basis for the analysis plan [2].
Analysis Plan
The final stage of problem formulation is the development of a detailed analysis plan. This plan specifies the methods for evaluating the risk hypotheses presented in the conceptual model. It defines the measures and metrics for exposure (e.g., predicted environmental concentrations, bioaccumulation factors) and effects (e.g., LC50, NOAEC), outlines the assessment design, and details how data will be analyzed to characterize risk [2]. A crucial part of this plan is establishing Data Quality Objectives (DQOs) to ensure the type, quantity, and quality of data collected are sufficient for making the required decisions [43].
Table 1: Key Components of a Problem Formulation Analysis Plan
| Component | Description | Example Output/Consideration |
|---|---|---|
| Risk Hypotheses | Clear statements predicting relationships between stressor, exposure, and effect [2]. | "Surface water runoff of Pesticide X will lead to concentrations in pond Y that reduce survival of aquatic invertebrates." |
| Exposure Analysis | Plan for estimating the co-occurrence of stressor and receptor [12]. | Use of models (e.g., PRZM, EXAMS) to estimate peak aquatic concentrations; field monitoring design. |
| Effects Analysis | Plan for evaluating stressor-response relationships [12]. | Compilation of toxicity data for surrogate species; selection of most sensitive endpoint for each taxa. |
| Measures & Metrics | Specific numerical values or criteria used for evaluation [2]. | LC50 (median lethal concentration), NOAEC (No Observed Adverse Effect Concentration), EEC (Estimated Environmental Concentration). |
| Data Quality Objectives | Qualitative and quantitative statements defining data needs [43]. | Acceptable level of decision error; required detection limits; number of samples. |
Case Application 1: Pesticide Risk Assessment
For pesticide registration and review, problem formulation focuses on characterizing the proposed use pattern and identifying the most sensitive non-target organisms and exposure pathways.
Assessment Endpoints: For screening-level pesticide assessments, typical endpoints focus on direct acute and chronic effects on individual organisms that serve as surrogates for broader taxonomic groups. Common endpoints include mortality (acute risk) and reduced growth or reproduction (chronic risk) for birds, mammals, fish, aquatic invertebrates, and non-target plants [2].
Conceptual Model Development: The model begins with the pesticide application method and rate as described on the product label. Key pathways include spray drift to adjacent habitats, runoff to surface water, leaching to groundwater, and uptake by plants. Receptors are identified based on their presence in these compartments and their biological sensitivity. For instance, a model for an herbicide applied to corn would diagram pathways from soil to earthworms and soil microbes, and via runoff to aquatic plants and invertebrates in nearby streams [42].
Analysis and Data Requirements: The analysis relies heavily on standardized toxicity studies (e.g., OECD, EPA guidelines) conducted on surrogate species. Exposure is typically modeled for worst-case scenarios representing the highest plausible exposures [2]. Advanced analytical chemistry is critical for validating models and monitoring. Key methodologies include:
- Sample Preparation: Involves extraction (using solvents like acetone or hexane), clean-up (via Solid-Phase Extraction or Liquid-Liquid Extraction), and concentration to isolate pesticide residues from complex matrices like soil, water, or plant tissue [44].
- Analytical Techniques: Gas Chromatography coupled with Mass Spectrometry (GC-MS) is used for volatile, thermally stable pesticides. Liquid Chromatography with tandem MS (LC-MS/MS) is preferred for polar, non-volatile, or thermally labile compounds [44]. Recent research focuses on methods to quantify multiple residues efficiently, such as using statistical correlations between a few "predictor" compounds and many "target" compounds to reduce calibration burden [45].
Table 2: Summary of Analytical Techniques for Pesticide Residue Analysis
| Technique | Best For | Typical Sample Prep | Key Advantage |
|---|---|---|---|
| GC-MS / GC-MS/MS | Volatile, thermally stable pesticides (e.g., organophosphates, pyrethroids) [44]. | Solvent extraction, derivatization for some compounds. | Excellent separation power; robust spectral libraries for identification. |
| LC-MS/MS | Polar, non-volatile, thermally unstable pesticides (e.g., glyphosate, neonicotinoids) [44]. | Solid-Phase Extraction (SPE), filtration. | Can analyze a wide range of compounds without derivatization; high sensitivity and selectivity. |
| Statistical Predictive Models | High-throughput screening of multiple residues in food matrices [45]. | Standard extraction & clean-up. | Reduces need for individual calibration standards for each compound, saving time and resources. |
Case Application 2: Contaminated Site Assessment
For contaminated sites (e.g., Superfund, brownfields), problem formulation is highly site-specific, aimed at determining if contamination poses an unacceptable ecological risk and guiding remediation decisions.
Assessment Endpoints: Endpoints must reflect the local ecosystem's valued components. These could include the health of resident fish and wildlife populations, the diversity and function of benthic invertebrate communities, or the sustainability of wetland vegetation. The protection of threatened or endangered species, if present, is often a paramount concern [12].
Conceptual Site Model (CSM) Development: The CSM is a detailed, site-specific version of the conceptual model. It integrates all known information about the site's physical setting (hydrogeology, climate), contamination source(s) (e.g., disposal pit, leaking tank), the Chemicals of Potential Concern (COPCs), their fate and transport mechanisms (e.g., groundwater plume, dust emissions), the complete exposure pathways (e.g., soil ingestion, dietary uptake), and the location and habits of ecological receptors [43]. The CSM is iterative, updated as new data is collected during the remedial investigation.
Analysis and Data Requirements: The analysis phase involves extensive field sampling and laboratory analysis to characterize the nature and extent of contamination and its effects. Key tools include:
- Ecological Soil Screening Levels (Eco-SSLs): These are risk-based, generic screening values for soil contaminants. Concentrations below Eco-SSLs are considered unlikely to pose ecological risk, while exceedances trigger further site-specific evaluation [46].
- Field Surveys and Biological Monitoring: These may include toxicity tests (e.g., sediment tests with amphipods), bioaccumulation studies, and surveys of community structure (e.g., fish population surveys, benthic macroinvertebrate indexing) to measure actual effects [12].
- Data Quality Objectives Process: Systematic planning via the DQO process is vital to ensure data collected is of sufficient type, quality, and quantity to support risk management decisions. This leads to the development of a Quality Assurance Project Plan (QAPP) and a Sampling and Analysis Plan (SAP) [43].
Contaminated Site Conceptual Model Flow
Advanced Methodologies and Future Directions
Cumulative Risk Assessment (CRA): Traditional risk assessments often evaluate chemicals singly, yet ecosystems are exposed to mixtures. The Food Quality Protection Act mandates CRA for pesticides sharing a common mechanism of toxicity. Problem formulation for CRA is more complex, requiring the identification of the chemical group, all relevant exposure pathways (dietary, water, residential), and the consideration of aggregate exposure from multiple sources [47]. The 2025 EPA Guidelines for Cumulative Risk Assessment Planning and Problem Formulation provides a modern framework for this process, emphasizing early planning and stakeholder involvement [47].
Statistical and Data Science Approaches: Problem formulation must adapt to new analytical capabilities. The use of advanced statistical methods, such as developing predictive models based on correlations between detector responses for different pesticides, can streamline quantification and reduce laboratory resource demands [45]. Furthermore, systematic Data Quality Assessment (DQA) procedures, which apply graphical and statistical tools to verify data meet the DQOs, are essential for ensuring the reliability of the data underpinning the risk assessment [48].
Problem Formulation Phase Workflow
The Scientist's Toolkit: Key Research Reagent Solutions
- Solid-Phase Extraction (SPE) Cartridges: Used for sample clean-up and concentration. Sorbents (e.g., C18 for non-polar compounds) selectively retain target analytes, removing interfering matrix components and improving analytical accuracy [44].
- Deuterated or Isotopically Labeled Internal Standards: Added to samples prior to extraction. They correct for analyte loss during sample preparation and matrix effects during instrumental analysis (e.g., in LC-MS/MS), ensuring precise quantification [45].
- Certified Reference Materials (CRMs) and Calibration Standards: Pure analyte standards of known concentration used to calibrate analytical instruments. CRMs with analytes in a matrix similar to the sample (e.g., pesticide residues in soil) are used to validate method accuracy and precision [48].
- Toxicity Test Organisms: Standardized, sensitive surrogate species (e.g., Daphnia magna for freshwater invertebrates, Xenopus laevis for amphibians) used in laboratory assays to generate reproducible dose-response data for ecological effects characterization [2].
Effective problem formulation is a disciplined, collaborative science that sets the trajectory for the entire ecological risk assessment. By rigorously defining the problem through assessment endpoints, conceptual models, and analysis plans, risk assessors provide a clear, logical, and defensible foundation for evaluating the risks posed by pesticides and contaminated sites. As methodologies advance—embracing cumulative risk, sophisticated statistical models, and ever-more-sensitive analytical techniques—the principles of problem formulation remain constant: to ensure assessments are focused on relevant risks, transparent in their uncertainties, and directly supportive of sound environmental decision-making. For the research community, mastering this phase is not merely a procedural step but a critical scientific contribution to protecting ecological health.
Navigating Complexities: Solutions for Data Gaps, Uncertainty, and Stakeholder Dynamics
Identifying and Addressing Critical Data Gaps in Stressor and Ecosystem Characterization
Ecological Risk Assessment (ERA) is the formal, scientifically-grounded process for evaluating the likelihood and severity of adverse environmental impacts resulting from exposure to one or more stressors, such as chemicals, land-use changes, or invasive species [7]. As a cornerstone of evidence-based environmental management, its ultimate goal is to inform decisions that protect natural resources and the ecological services they provide [7] [49].
The foundational phase of this process is problem formulation, a critical stage that establishes the assessment's entire trajectory [2] [4] [3]. During problem formulation, risk assessors and managers integrate available information to define the scope, select assessment endpoints (the specific ecological values to be protected), and develop conceptual models that illustrate hypothesized relationships between stressors and ecological effects [2] [3]. The quality and completeness of the data integrated at this stage directly determine the assessment's relevance, efficiency, and ultimate defensibility.
However, this phase invariably encounters critical data gaps in the characterization of both stressors and ecosystems. These gaps create uncertainty, which can lead to assessments that are either overly conservative (imposing unnecessary management costs) or insufficiently protective (allowing environmental degradation) [40] [49]. This technical guide examines the nature of these pervasive data gaps, situates them within the problem formulation framework, and provides methodologies for their systematic identification and strategic resolution to produce more robust and actionable ecological risk assessments.
Table 1: Core Phases of Ecological Risk Assessment and Associated Data Challenges [7] [2] [3].
| ERA Phase | Primary Objective | Key Outputs | Common Data Gaps Encountered |
|---|---|---|---|
| Planning | Establish dialogue between risk managers and assessors; define goals, scope, and resources. | Management goals, agreed scope, assessment team. | Unclear protection goals, mismatched stakeholder expectations, undefined spatial/temporal boundaries. |
| Problem Formulation | Define the problem and develop a plan for analysis based on available science. | Assessment endpoints, conceptual model, analysis plan. | Incomplete stressor identity/mode of action, poorly characterized ecosystem attributes, undefined exposure pathways. |
| Analysis | Evaluate exposure to stressors and the relationship between exposure and ecological effects. | Exposure profile, stressor-response relationships. | Lack of site-specific exposure data, insufficient toxicity data for relevant species/endpoints. |
| Risk Characterization | Estimate and describe risk by integrating exposure and effects analyses. | Risk estimate with description of uncertainty. | Inability to extrapolate across biological scales, unquantified uncertainty from earlier gaps. |
The Centrality of Problem Formulation in Defining Data Needs
Problem formulation is the bridge between policy-driven management goals and scientific analysis [2] [4]. It transforms broad questions like "is this pesticide safe for the environment?" into a set of testable risk hypotheses and a clear analysis plan [3]. The process involves several key steps, each of which exposes specific data needs and potential deficiencies [2] [3]:
- Integrating Available Information: This initial scoping reviews existing data on stressor sources, characteristics, ecosystem attributes, and known effects. Gaps identified here determine the plausibility of proceeding and highlight areas requiring precautionary assumptions [2] [3].
- Selecting Assessment Endpoints: These are explicit expressions of the ecological values to be protected, defined by a valued entity (e.g., a fish population) and a key attribute (e.g., reproductive success) [2] [4]. A major challenge is the frequent mismatch between these policy-relevant endpoints and the measurement endpoints (e.g., laboratory LC50 for a standard test species) for which data are readily available [40].
- Developing a Conceptual Model: This diagrammatic model illustrates the predicted relationships between stressors, exposure pathways, and assessment endpoints. Its construction forces the explicit identification of unknown or uncertain linkages, visually mapping the data gaps in the stressor-ecosystem interaction [2] [3].
- Creating an Analysis Plan: The final step defines how each component of the conceptual model will be evaluated, specifying required data types, models, and decision points. It is a direct blueprint for data collection or for justifying the use of extrapolations and proxies [2].
An inadequate problem formulation, often stemming from unacknowledged data gaps, compromises the entire ERA. It can lead to irrelevant data collection, an inability to characterize risk meaningfully, and decision-making paralysis [4] [50]. The following diagram outlines this integrative process and its key decision points.
Problem Formulation Process and Data Gap Identification
Critical Data Gaps in Ecosystem Characterization
A comprehensive understanding of the ecosystem at risk is paramount. Current characterization efforts are often hampered by significant, systemic data deficiencies that limit the ecological realism of assessments [51] [52] [53].
Gaps in Representing Ecosystem Structure, Composition, and Function
Ecosystem condition is multidimensional, encompassing its structure (physical organization), composition (identity and diversity of species), and function (ecological processes) [51]. A recent review of spatially explicit indicators found a strong bias towards structural attributes (e.g., land cover, forest canopy volume), which are often easier to measure via remote sensing [51]. In contrast, compositional data (particularly for non-charismatic taxa like soil invertebrates) and functional data (e.g., nutrient cycling rates, decomposition) remain severely underrepresented, creating an incomplete picture of ecosystem health and resilience [51] [52].
The Disconnect from Final Ecosystem Services
A fundamental gap exists between measured ecosystem characteristics and the final ecosystem services that society values and that management aims to protect, such as clean water, crop pollination, or recreational fishing [53]. Ecologists often measure "intermediate" variables (e.g., soil organic matter, insect biomass), while policymakers need to understand outcomes for human well-being. The lack of validated ecological production functions—models that quantitatively link changes in ecosystem characteristics to changes in final service delivery—is a major data and methodological bottleneck [53]. This forces reliance on simplistic benefit transfers (applying data from one site to another) with high uncertainty [53].
The Taxonomic and Biological Scale Mismatch
ERA has traditionally relied on toxicity data from a limited suite of standard laboratory species (e.g., Daphnia magna, fathead minnow) [2] [40]. This creates a critical gap regarding the sensitivity of protected, endangered, or functionally unique species that are rarely tested [52]. Furthermore, effects measured on individuals (e.g., mortality, growth) must be extrapolated to assess risks to populations, communities, and ecosystem functions—a process fraught with uncertainty [40]. The scarcity of data at higher levels of biological organization (e.g., from mesocosm or field studies) makes it difficult to validate these extrapolations or to capture emergent properties and ecological interactions [40].
Table 2: Key Data Gaps in Ecosystem Characterization and Their Implications for ERA [51] [52] [53].
| Gap Category | Specific Data Deficiency | Consequence for Problem Formulation & ERA |
|---|---|---|
| Composition & Function | Lack of baseline data on species composition (especially microbiota, invertebrates) and process rates (decomposition, primary productivity). | Inability to define meaningful, ecosystem-level assessment endpoints or to detect subtle, functional shifts before structural collapse. |
| Service-Linkage | Absence of quantitative ecological production functions linking ecosystem metrics to final services (e.g., water purification, flood control). | Prevents framing risks in terms of service losses that resonate with managers and the public; forces use of unreliable proxies. |
| Taxonomic Coverage | Toxicity and life-history data are missing for most species, particularly rare, endangered, or keystone species. | Undermines the protection of biodiversity; requires use of uncertain safety (assessment) factors when extrapolating from standard test species. |
| Spatial & Temporal Dynamics | Limited time-series and spatially explicit data on ecosystem variability and stressor exposure at relevant scales. | Hampers accurate exposure assessment and makes it difficult to distinguish anthropogenic stress from natural variation. |
Critical Data Gaps in Stressor Characterization and Exposure Assessment
Accurately characterizing the stressor and predicting or measuring exposure is equally challenging. Data gaps here directly affect the exposure side of the risk equation.
Inadequate Characterization of Real-World Exposure Scenarios
Laboratory toxicity tests use constant, single-stressor exposures, but real-world environments present variable, pulsed, and multi-stressor exposures [40] [3]. Data on the timing, frequency, and duration of stressor events (e.g., pesticide runoff after rain) are often lacking [3]. Furthermore, organisms are exposed to complex mixtures of chemicals and non-chemical stressors (e.g., habitat loss + temperature increase + contaminant). The almost complete lack of toxicological data on relevant mixtures and the interactive effects of multiple stressors represents a profound data gap, leading to assessments that may underestimate cumulative risk [52] [40].
Fate, Transport, and Bioavailability Data
To estimate exposure, assessors need to model or measure how a stressor moves and changes in the environment (fate and transport) and its fraction that is biologically available [3] [49]. Key data gaps include:
- Site-specific environmental parameters (e.g., soil organic carbon, water hardness) that modulate bioavailability and toxicity [3].
- Metabolite and degradation product identity and toxicity. The parent compound may be less relevant than its environmental transformation products [2].
- Bioaccumulation and biomagnification factors for a wide range of species and ecosystems, which are critical for assessing risks to upper-trophic-level organisms [3].
The following diagram illustrates how data gaps at various stages of characterization cascade into uncertainty during the risk assessment process.
Cascade of Data Gaps Through the Risk Assessment Process
Methodologies and Experimental Protocols for Addressing Data Gaps
Addressing these gaps requires targeted, scientifically robust methodologies. The following protocols outline approaches for generating critical data at different biological scales.
Protocol for Higher-Tier Mesocosm Studies
Objective: To assess community- and ecosystem-level effects of a stressor under semi-natural, replicated conditions, bridging the gap between single-species lab tests and field observations [40].
- Design: Establish replicated outdoor pond, stream, or soil mesocosms that mimic key attributes of the target ecosystem (e.g., nutrient levels, sediment type, representative community of algae, invertebrates, and possibly plants) [40].
- Dosing: Apply the stressor (e.g., chemical) in a regime that mimics realistic exposure (e.g., a single pulse, repeated pulses). Include multiple treatment concentrations and untreated controls [40].
- Monitoring: Sample biological endpoints regularly over a period covering multiple generations of key species. Endpoints should include:
- Structural: Species abundance, richness, and diversity indices for multiple taxonomic groups.
- Functional: Leaf litter decomposition rates, primary productivity (chlorophyll-a, dissolved oxygen), nutrient cycling.
- Population: Vital rates (survival, growth, reproduction) of key sentinel species [40].
- Analysis: Use multivariate statistics (e.g., PERMANOVA) to detect treatment-related changes in community structure. Calculate no-observed-effect-concentrations (NOECs) or effect concentrations (ECs) for specific functional and structural endpoints.
Protocol for Developing Ecological Production Functions (EPFs)
Objective: To create a quantitative model linking a measurable change in an ecosystem characteristic to a change in a final ecosystem service [53].
- Endpoint Definition: Collaboratively define a final service endpoint with stakeholders (e.g., "gallons of water purified per day to meet Standard X") [53].
- Identify Key Driver: Determine the ecosystem characteristic (intermediate service) that is the primary biophysical driver of the final service (e.g., "filtration capacity of riparian wetlands," driven by soil texture, vegetation root density, and microbial activity) [53].
- Data Collection: Conduct empirical studies or synthesize existing data to measure both the driver characteristic and the final service output across a gradient of conditions (e.g., wetlands of differing vegetation density and soil types) [53].
- Model Fitting: Use statistical modeling (e.g., regression, machine learning) to fit a function (the EPF) that predicts the final service output as a function of the driver characteristic and other relevant variables (e.g., Y water purified = f(root density, soil type, inflow concentration)) [53].
- Validation and Application: Test the EPF in a new setting to validate its predictive power. The validated EPF can then be used in ERA to translate predicted ecological changes into quantifiable service losses [53].
Protocol for Stressor-Response Assessment for Non-Standard Species
Objective: To generate toxicity data for species of conservation concern or high ecological value that are not part of standard test batteries [52].
- Species Selection: Prioritize species based on IUCN Red List status, ecological role (keystone, ecosystem engineer), or high suspected vulnerability to the stressor [52].
- Culturing & Acclimation: Develop captive culture or collection methods that provide healthy, consistent test organisms. Acclimate them to laboratory conditions.
- Test Design: Adapt standard OECD or EPA guideline test principles (e.g., 96-hr acute, partial- or full-lifecycle chronic) to the species' biology. Key adaptations may involve temperature, light cycle, food, and sensitive life stages [40].
- Endpoint Selection: Include standard endpoints (survival, growth) and ecologically relevant sub-lethal endpoints (e.g., feeding rate, behavioral avoidance, reproductive output).
- Data Analysis: Fit dose-response models to calculate LC/EC/NOEC values. Compare sensitivity to standard test species to evaluate the adequacy of existing assessment factors [52].
Table 3: Research Reagent Solutions for Advanced Ecological Risk Assessment Studies.
| Reagent/Material | Primary Function | Application in Addressing Data Gaps |
|---|---|---|
| Standardized Artificial Soil/Sediment | Provides a consistent, reproducible substrate for terrestrial and benthic invertebrate toxicity tests. | Enables testing of non-standard soil species (e.g., endemic earthworms) and generates reproducible bioavailability data [40]. |
| Passive Sampling Devices (e.g., SPMDs, POCIS) | Integrates and concentrates bioavailable fractions of contaminants (hydrophobic organics, polar compounds) in water over time. | Measures time-weighted average (TWA) exposure concentrations in mesocosms or field studies, addressing pulsed exposure data gaps [3]. |
| Environmental DNA (eDNA) Extraction & Sequencing Kits | Allows for the detection and identification of species (from microbes to vertebrates) from environmental samples via DNA metabarcoding. | Revolutionizes compositional data collection for ecosystem characterization, providing high-resolution biodiversity data non-invasively [51]. |
| Stable Isotope Tracers (e.g., ¹⁵N, ¹³C) | Used to trace the flow of nutrients and energy through food webs and to measure process rates. | Quantifies ecosystem functional endpoints (e.g., decomposition rates, trophic transfer) in mesocosm and field studies [53] [40]. |
| Species Sensitivity Distribution (SSD) Software | Statistical package for fitting distributions to toxicity data from multiple species to estimate a protective concentration (e.g., HC₅). | A key tool for extrapolating from limited single-species data to community-level protection, formalizing this critical uncertainty [52] [40]. |
An Integrated Framework for Bridging Gaps and Informing Problem Formulation
Closing data gaps requires more than new experiments; it demands a more integrated framework for problem formulation itself. Two key integrative approaches are:
- Bridging Nature Conservation and Risk Assessment: Actively using the IUCN Red List and other conservation databases to prioritize species for ecotoxicological testing [52]. Conversely, ERA data on chemical threats should inform the "threat classification" schemes used by conservation biologists, moving from generic labels like "pollution" to specific, actionable threats [52].
- Adopting an Iterative, Top-Down and Bottom-Up Approach: Problem formulation should not be a one-time event. It should embrace an iterative cycle:
- Top-Down: Start with the management goal (protect service Y) and define the required assessment endpoints and data needs [53].
- Bottom-Up: Evaluate existing data (e.g., standard toxicity tests, remote sensing) to see what risks can be provisionally identified [40].
- Iterate: The mismatch between the top-down needs and bottom-up data explicitly defines the critical gaps. Resources can then be strategically allocated to fill them, after which the problem formulation and risk assessment are refined [49].
The final diagram presents this integrated, iterative framework for conducting problem formulation in a way that systematically identifies and prioritizes data gaps for closure.
Integrated Framework for Problem Formulation and Gap Analysis
Critical data gaps in stressor and ecosystem characterization are not merely technical inconveniences; they are fundamental sources of uncertainty that can undermine the entire ecological risk assessment enterprise. By systematically identifying these gaps during the problem formulation phase—through the explicit development of conceptual models, the clear articulation of assessment endpoints, and the honest appraisal of data—risk assessors can transform a weakness into a strategic guide.
The path forward requires a dual commitment: to the strategic generation of new data using higher-tier methodologies that capture ecological complexity, and to the innovative integration of existing knowledge from formerly disparate fields like conservation biology and ecosystem services science. Embedding an iterative, gap-aware approach into problem formulation ensures that ERAs are focused, efficient, and ultimately more capable of delivering the scientifically defensible evidence required to protect ecological systems in a complex and changing world.
Managing Uncertainty in Early Assessment Phases and Developing Iterative Approaches
Ecological risk assessment (ERA) is a disciplined process used to evaluate the likelihood and magnitude of adverse ecological effects resulting from human activities or stressors, such as the introduction of chemical pesticides or genetically modified organisms (GMOs) [12]. Within this scientific discipline, the initial phase of problem formulation is not merely a preliminary step but the critical foundation for managing inherent uncertainty and framing an effective, iterative assessment [2] [4]. This phase establishes the parameters for the entire assessment by integrating policy goals, scientific understanding, and management needs into a structured plan [4].
The core challenge in early assessment is navigating scientific and decision-making uncertainty. Uncertainty arises from multiple sources: incomplete knowledge about stressor characteristics, variable ecosystem responses, limitations in exposure models, and the extrapolation of laboratory data to complex field conditions [2] [12]. A rigid, linear assessment approach can amplify these uncertainties, leading to assessments that are either inconclusive, inefficient in resource use, or misaligned with management decisions [54] [50]. In contrast, a robust problem formulation stage explicitly identifies and acknowledges these uncertainties. It transforms them from hidden vulnerabilities into defined parameters of the study, allowing for the design of an iterative process that can systematically reduce uncertainty through targeted analysis and data collection [2] [4].
This whitepaper frames its discussion within the broader thesis that problem formulation is the primary tool for uncertainty governance in ecological risk research. By demanding upfront clarity on assessment endpoints, conceptual models, and analysis plans, problem formulation forces a confrontation with the known unknowns. This process enables the development of iterative, tiered approaches—beginning with conservative screening-level assessments and proceeding to more complex, resource-intensive evaluations only as needed [2] [12]. Such an adaptive framework ensures scientific rigor, regulatory relevance, and efficient use of resources, ultimately leading to more resilient and defensible environmental decisions [54] [55].
Conceptual Foundations: The Problem Formulation Framework
The problem formulation phase is a collaborative, planning dialogue between risk assessors and risk managers [2]. Its objective is to distill a broad management concern into a focused, scientifically testable assessment strategy. The U.S. Environmental Protection Agency (EPA) outlines this as a structured process that converts planning agreements into actionable hypotheses and analysis plans [2] [12]. A failure to adequately perform problem formulation can compromise the entire ERA, leading to requests for irrelevant data, miscommunication of findings, and delayed decision-making [4].
Core Components of Problem Formulation
The process integrates several key components, each designed to bound uncertainty and set the course for iteration [4]:
- Management Goals & Assessment Endpoints: Management goals are high-level statements about the ecological values to be protected (e.g., "maintaining a sustainable aquatic community") [2]. Problem formulation refines these into concrete assessment endpoints, which consist of an explicit ecological entity (e.g., a species, community, or ecosystem function) and a specific attribute of that entity that is sensitive to the stressor (e.g., survival, reproduction, growth) [12] [4]. This precision prevents ambiguity about what is being protected and measured.
- Conceptual Model Development: A conceptual model is a visual and narrative tool that illustrates the hypothesized relationships between the stressor source, exposure pathways, and the assessment endpoints [2] [12]. It is comprised of a diagram and a set of risk hypotheses—testable statements about how adversity might occur [4]. Developing this model identifies knowledge gaps, justifies the assessment focus, and ranks components by their associated uncertainty.
- Analysis Plan: This final product of problem formulation specifies the methods, data requirements, and measures that will be used to evaluate the risk hypotheses [2]. It details how exposure and effects will be analyzed and defines the criteria for characterizing risk. The plan explicitly identifies data gaps and articulates the level of uncertainty that can be tolerated in the decision-making context, thereby setting the stage for iterative data gathering [12].
The Role of Iteration and Tiered Assessment
A seminal outcome of problem formulation is the decision on the assessment's scope and complexity [2]. Recognising that resources are finite, a tiered, iterative approach is often prescribed. This approach begins with simple, conservative models and screening criteria (Tier 1). If risks are indicated at this initial tier, the assessment proceeds to more sophisticated and realistic evaluations (Tiers 2 and 3), which may include refined modeling, field studies, or probabilistic analyses [12]. This stepwise process efficiently allocates resources by focusing greater effort only on risks that survive conservative initial screens, thereby managing uncertainty through sequential refinement rather than attempting to eliminate it in a single, monumental effort.
The following diagram illustrates this iterative cycle, showing how problem formulation is central to an adaptive process that evolves based on analysis findings and new information.
Iterative Ecological Risk Assessment Cycle
Table 1: Quantitative Data Sources and Uncertainty in Early-Tier Assessments
| Data Type | Typical Source | Key Uncertainty Factors | Common Iterative Refinement |
|---|---|---|---|
| Toxicity Effects | Standardized laboratory tests (e.g., LC₅₀, NOAEC) [2] | Interspecies extrapolation; laboratory to field extrapolation; acute to chronic ratios [12]. | Use species sensitivity distributions (SSDs); apply assessment factors; conduct chronic or life-cycle tests [12]. |
| Exposure Concentration | Default model estimates (e.g., EPA models) [2] | Parameter uncertainty (e.g., runoff values, degradation rates); model boundary conditions [50]. | Incorporate monitoring data; use probabilistic modeling (e.g., Monte Carlo); refine spatial/temporal scales [54] [12]. |
| Ecological Receptors | Surrogate species data [2] | Relevance of surrogate to endpoint entity; population vs. individual level effects [12]. | Develop species-specific data; model population dynamics; assess community structure [12]. |
Methodologies for Iterative Assessment and Uncertainty Analysis
Moving from concept to practice requires specific methodological frameworks designed for adaptability. These frameworks embed iteration within their structure, allowing risk assessments to be responsive to new data and evolving questions.
The Iterative Risk Assessment Framework
The EPA's guidelines and contemporary frameworks like the Risk-Tandem model advocate for a non-linear, circular process [12] [55]. This process is anchored by a robust problem formulation that is revisited as new information emerges from the analysis or risk characterization phases. For instance, a screening-level assessment (Tier 1) might indicate a potential risk using conservative assumptions. Instead of triggering an immediate management action, this result can initiate a Tier 2 assessment, where the problem formulation is refined—perhaps by narrowing the geographic scope, selecting more specific assessment endpoints, or employing a more realistic exposure model [2] [12]. This loop continues until the uncertainty is reduced to a level acceptable for the required decision.
Quantitative Tools for Managing Uncertainty
A critical function of iteration is the progressive reduction of quantitative uncertainty. Several analytical techniques are central to this effort:
- Hypothesis-Driven Statistical Testing: The risk hypotheses generated during problem formulation must be evaluated with statistical rigor. Common tests include the t-test to compare means (e.g., observed vs. predicted effects) and the F-test to compare variances between datasets [56]. Establishing a pre-defined level of significance (α, commonly 0.05) is crucial for objective decision-making within the iterative cycle [56].
- Probabilistic and Advanced Modeling: Moving beyond deterministic "point estimate" assessments is key to managing uncertainty. Probabilistic methods, such as Monte Carlo simulation, allow assessors to input distributions for key parameters (e.g., toxicity, exposure) and generate a distribution of possible risk outcomes [54]. This quantitatively expresses uncertainty and helps identify which parameters most influence the risk estimate, guiding targeted data collection in the next iterative cycle.
- Scenario Planning and Stress Testing: This involves developing multiple plausible future scenarios (e.g., different climate conditions, land-use patterns) and evaluating the performance of risk management options across them [54]. It helps decision-makers understand the robustness of a decision under deep uncertainty and can be integrated iteratively as forecasts and models improve.
The workflow below details how quantitative data analysis is integrated into this iterative framework, from initial data comparison to hypothesis testing and decision-making.
Quantitative Data Analysis Workflow in Iterative Assessment
Table 2: Statistical Methods for Comparing Data in Iterative Risk Assessment
| Method | Primary Use Case | Key Outputs | Role in Managing Uncertainty |
|---|---|---|---|
| t-test (Two-Sample) [56] | Comparing the mean values of two groups (e.g., exposed vs. control population response). | t-statistic, p-value. | Quantifies the probability that observed differences are due to chance. A high p-value may indicate need for more sensitive measures or larger sample size in next tier. |
| Analysis of Variance (ANOVA) [57] | Comparing means across three or more groups (e.g., effects across multiple species or concentrations). | F-statistic, p-value. | Identifies if variability between groups is significant relative to variability within groups, guiding focus on specific stressors or pathways. |
| Regression Analysis [57] | Modeling the relationship between a continuous dependent variable (e.g., mortality) and one/more independent variables (e.g., concentration, time). | Regression coefficients, R², p-values. | Characterizes dose-response, a core element of effects assessment. Uncertainty in the slope informs safety factor application or need for more data points. |
| Correlation Analysis [57] | Measuring the strength and direction of association between two variables. | Correlation coefficient (r). | Identifies potential causal links for hypothesis generation, but does not prove causation. Highlights relationships to be tested in subsequent focused studies. |
Implementation: Protocols and Practical Toolkit
Translating the iterative framework into actionable science requires standardized experimental protocols and a curated set of research tools. This section outlines a core experimental protocol for generating effects data and provides a toolkit for managing uncertainty.
Detailed Experimental Protocol: Tiered Toxicity Testing
This protocol exemplifies an iterative approach, starting with a standardized test and providing options for refinement.
- Objective: To determine the concentration-dependent effects of a chemical stressor on the survival and reproduction of a standard aquatic invertebrate (e.g., Daphnia magna) as a surrogate for aquatic ecosystem health [2].
- Materials:
- Test Organism: Cultured, age-synchronized Daphnia magna (<24 hours old for acute, <7 days old for chronic).
- Test Chemical: Prepared stock solution of known purity. Serial dilutions are made using standardized reconstituted water [56].
- Equipment: Static or flow-through exposure chambers, environmental control chambers (maintaining 20°C ±1, 16:8 light:dark), dissecting microscopes, water quality probes (pH, dissolved oxygen, conductivity) [56].
- Tier 1 – Acute Immobilization Test (48-hr):
- Expose five Daphnia neonates per vessel to a minimum of five concentrations of the chemical and a negative control (water only), with four replicates per concentration.
- Record immobilization (inability to swim after gentle agitation) at 24 and 48 hours.
- Calculate the median lethal concentration (LC₅₀) or median effective concentration (EC₅₀) using statistical software (e.g., probit analysis) [56].
- Tier 2 – Chronic Life-Cycle Test (21-day): Initiated if Tier 1 indicates potential risk.
- Expose individual Daphnia (initially <24 hrs old) to a sub-lethal range of concentrations.
- Renew test solutions and feed organisms daily.
- Monitor and record key endpoints: time to first reproduction, number of live offspring produced per adult (fecundity), and adult survival.
- Calculate the no-observed-adverse-effect concentration (NOAEC) and the lowest-observed-adverse-effect concentration (LOAEC) using statistical comparison to controls (e.g., Dunnett's test) [12].
- Data Analysis & Iteration: Tier 1 data provides a rapid screening value. Tier 2 chronic data significantly reduces uncertainty by identifying effects on critical population-relevant endpoints. If uncertainty about field relevance remains, the problem formulation could be updated to initiate a Tier 3 study, such as an in-situ microcosm test with multiple species [12].
The Scientist's Toolkit: Research Reagent Solutions for Uncertainty Management
The following table details essential tools and their specific functions in executing and iterating ecological risk assessments.
Table 3: Research Reagent Solutions for Iterative Ecological Risk Assessment
| Tool / Solution | Primary Function | Role in Managing Uncertainty |
|---|---|---|
| Standardized Test Organisms (e.g., Ceriodaphnia dubia, Oncorhynchus mykiss, Lolium perenne) [2] | Provide consistent, reproducible biological response data for toxicity effects assessment. | Reduces variability in effects data, allowing for more precise estimation of toxicity thresholds and clearer comparison across studies. |
| Environmental Fate Models (e.g., EPA's PRZM, EXAMS) [2] | Predict the concentration, distribution, and persistence of a stressor in environmental compartments (water, soil, sediment). | Quantifies exposure estimation uncertainty through scenario analysis; identifies worst-case exposure scenarios for screening and key parameters for refinement. |
| Probabilistic Software (e.g., @Risk, Crystal Ball, R packages) [54] | Enables Monte Carlo simulation and other probabilistic analyses to propagate parameter uncertainties through exposure and risk models. | Transforms qualitative uncertainty into quantitative probability distributions for risk, highlighting the most influential data gaps. |
| Geographic Information Systems (GIS) | Integrates spatial data on land use, hydrology, habitat, and stressor sources to create spatially explicit exposure models. | Reduces uncertainty by moving from generic to site-specific exposure assessments, identifying critical habitats and exposure pathways at relevant scales. |
| Molecular Biomarker Kits (e.g., for stress proteins, DNA damage, metabolic enzymes) | Measures sub-lethal, early-warning biological responses in organisms exposed to stressors. | Provides sensitive indicators of effect before population-level impacts occur, allowing for earlier detection and intervention in iterative monitoring. |
Effective ecological risk assessment in the face of complexity and uncertainty requires a fundamental shift from linear, deterministic processes to dynamic, iterative frameworks. As established in this whitepaper, the linchpin of this approach is a rigorous and iterative problem formulation phase. By forcing the explicit articulation of risk hypotheses, conceptual models, and analysis plans, problem formulation makes uncertainty visible and manageable [4] [50].
The iterative methodologies and quantitative tools described—from tiered testing and hypothesis-driven statistics to probabilistic modeling—provide the operational means to navigate this uncertainty. They allow risk assessments to be adaptive learning processes rather than one-time studies [55]. Initial conservative screens efficiently flag potential issues, and subsequent tiers invest resources to refine understanding where it matters most. This is not an exercise in endless data collection but a strategic, decision-focused effort to reduce uncertainty to levels sufficient for informed environmental management.
For researchers and drug development professionals, adopting this mindset has broad implications. It encourages the upfront investment in planning and problem scoping, justifies the use of sequential research designs, and legitimizes the reporting of uncertainty as a central component of risk characterization. Ultimately, embedding iteration into the fabric of ecological risk assessment strengthens its scientific credibility, regulatory utility, and capacity to protect environmental health in an uncertain world.
Aligning Divergent Stakeholder Interests and Ecological Protection Values
The central challenge in modern environmental management is the reconciliation of competing human priorities with the imperative of ecological protection. This challenge is fundamentally a problem of stakeholder alignment, where actors—governments, industries, local communities, and conservation groups—operate under divergent institutional logics, values, and goals [58]. In the context of ecological risk assessment (ERA), the critical phase of problem formulation serves as the essential bridge between these competing interests and the scientific assessment process [25] [12]. Problem formulation is where management goals are translated into specific, measurable assessment endpoints, defining what is to be protected and setting the scope of the scientific investigation [12]. This phase is inherently socio-ecological, requiring active collaboration among risk assessors, risk managers, and diverse stakeholders to ensure the assessment addresses the right questions and that its outcomes are actionable and legitimate [25].
Failure to adequately align stakeholder interests during problem formulation can render even the most rigorous scientific assessment irrelevant or contentious. This whitepaper provides a technical guide for researchers and scientists, particularly those in regulatory and drug development sectors, to systematically integrate stakeholder alignment strategies into the problem formulation stage of ERA. By drawing on frameworks from multi-stakeholder collaboration, quantitative ecosystem service risk assessment, and game-theoretic analysis, we outline methodologies to transform conflict into coherent, scientifically defensible assessment plans that support sustainable environmental decisions.
Deconstructing Divergence: Dimensions of Stakeholder Misalignment
Stakeholder divergence in environmental contexts is not monolithic; it manifests across specific, identifiable dimensions. Understanding these dimensions is the first step toward developing targeted alignment mechanisms. Research identifies three core axes of (mis)alignment in collaborative settings: cognition, goals, and practices [58].
Table 1: Dimensions of Stakeholder (Mis)Alignment in Ecological Contexts
| Dimension | Definition | Manifestation of Divergence | Potential Consequence for ERA Problem Formulation |
|---|---|---|---|
| Cognitive Alignment [58] | Alignment of values, beliefs, and perceptions regarding what is considered "valuable." | Differing value frames (e.g., intrinsic ecological value vs. resource utility). Disparate mental models of ecosystem function. | Inability to agree on protection goals and assessment endpoints. The public may prioritize charismatic species, while ecologists emphasize keystone functions [40]. |
| Goal Alignment [58] | Consistency and agreement on the objectives of collaboration or management. | Incongruent organizational priorities (e.g., profit maximization vs. biodiversity conservation). Different timelines for outcomes. | Conflict over the management goals that drive the ERA. A developer seeks rapid project approval, while a regulator requires long-term safety data. |
| Practice Alignment [58] | Degree to which processes, competencies, and activities are integrated and mutually supportive. | Incompatible data standards, work routines, or decision-making protocols. | Breakdown in the analysis phase of ERA. Industry toxicity tests may use standardized species, while ecological models require population-level data, creating an extrapolation gap [40]. |
These dimensions are often rooted in the stakeholders' adherence to different institutional logics, such as commercial logic (maximizing market value) versus sustainability logic (preserving natural resources) [58]. In the Caohai National Nature Reserve, for example, these divergent logics drove distinct land-use strategies among managers, developers, and residents, leading to clear phases of ecological degradation and recovery correlated with shifts in regulatory enforcement and incentives [59].
Diagram 1: Stakeholder Alignment Dimensions in ERA Problem Formulation
Integrative Methodologies for Alignment and Assessment
Addressing stakeholder divergence requires integrative methodologies that combine participatory processes with quantitative, transparent scientific assessment. Two advanced approaches are particularly effective: the integration of Ecosystem Services (ES) into ERA, and the application of evolutionary game theory to model stakeholder interactions.
Quantitative Ecosystem Service Risk-Benefit Assessment
Traditional ERA often focuses on risks to specific organism-level endpoints (e.g., survival, growth), creating a gap between what is measured and broader societal values like ecosystem services [60]. A novel ERA-ES methodology bridges this gap by using cumulative distribution functions (CDFs) to quantify both risks and benefits to ES supply resulting from human activities [60].
Table 2: ERA-ES Methodology: Key Steps and Application [60]
| Step | Description | Technical Protocol | Case Study Application: Offshore Wind Farm (OWF) |
|---|---|---|---|
| 1. Define ES Endpoint | Select a relevant ecosystem service as the assessment endpoint. | Use frameworks like Millennium Ecosystem Assessment. Engage stakeholders to identify valued services. | Endpoint: Waste remediation via sediment denitrification. |
| 2. Quantify Baseline & Impact | Model the relationship between ecosystem processes, drivers, and ES supply. | Develop statistical models (e.g., regression) linking environmental drivers to ES metrics. | Model denitrification rate as a function of sediment Total Organic Matter (TOM) and Fine Sediment Fraction (FSF). |
| 3. Establish Thresholds | Define critical thresholds for "risk" (degradation) and "benefit" (enhancement). | Use statutory limits, historical baselines, or stakeholder-derived targets. | Set thresholds based on baseline conditions before OWF construction. |
| 4. Construct CDFs & Calculate Metrics | Use probabilistic exposure scenarios to build CDFs for ES supply under impact. | Calculate: Risk Magnitude (RM), Risk Probability (RP), Benefit Magnitude (BM), Benefit Probability (BP). | OWF scenario: RP=73%, RM=21.8% (decrease in denitrification). Combined OWF & mussel culture: BP=100%, BM=62.6% (net increase). |
| 5. Comparative Analysis | Compare risk/benefit metrics across management scenarios. | Visualize CDF plots; compare RM, RP, BM, BP across scenarios. | Demonstrated multi-use scenario (OWF + aquaculture) provided net ecological benefit vs. OWF alone. |
This method transforms abstract values into quantifiable metrics, allowing stakeholders to compare trade-offs transparently. For example, it can show regulators and developers how modifying a project design changes the probability and magnitude of impacting a service like water purification [60].
Evolutionary Game Theory for Modeling Stakeholder Interactions
Game theory models strategic interactions where the outcome for one actor depends on the choices of others. Evolutionary game theory extends this by simulating how strategies evolve over time based on their relative success, making it suitable for modeling dynamic stakeholder behavior in land-use conflicts [59].
Experimental Protocol: Constructing a Stakeholder Evolutionary Game Model
- Identify Key Players & Strategies: Define the primary stakeholder groups (e.g., Managers/Regulators, Developers/Enterprises, Residents/Farmers). For each, identify discrete strategic choices (e.g., "Strict Regulation" vs. "Lax Regulation"; "Sustainable Development" vs. "Exploitative Development"; "Participate in Conservation" vs. "Not Participate") [59].
- Parameterize the Payoff Matrix: Use field surveys, historical data, and expert elicitation to quantify the costs, benefits, and incentives for each strategy combination. Key parameters include:
- Economic incentives: Land rents, subsidies (S), ecological compensation payments.
- Regulatory mechanisms: Fines or penalties (P) for non-compliance.
- Ecological & Social Costs: Quantified loss of ES value, social conflict costs. Survey data from 392 respondents in the Caohai Reserve were used to calibrate these parameters [59].
- Develop Replicator Dynamics Equations: Model the change in the proportion of a population adopting a particular strategy over time as a function of its payoff relative to the average payoff. The system of differential equations takes the form: ( \dot{x}i = xi[U(i) - \bar{U}] ), where ( x_i ) is the proportion using strategy ( i ), ( U(i) ) is its payoff, and ( \bar{U} ) is the average payoff.
- Solve for Evolutionary Stable Strategies (ESS): Analyze the model to find equilibrium points where no player can benefit by unilaterally changing strategy. Use Jacobian matrix analysis to determine the stability of each equilibrium.
- Numerical Simulation & Sensitivity Analysis: Using software like MATLAB, simulate the evolution of stakeholder strategies over time under different initial conditions and parameter values (e.g., varying penalty P or subsidy S). This identifies leverage points where policy interventions can shift the system toward a cooperative, ecologically favorable equilibrium [59].
Diagram 2: Evolutionary Game Workflow for Stakeholder Strategy Analysis
The Scientist's Toolkit: Essential Reagents for Integrated Analysis
Conducting research that aligns stakeholder interests with ecological protection requires a suite of specialized conceptual and analytical tools.
Table 3: Research Reagent Solutions for Stakeholder-Ecological Integration
| Tool/Reagent | Category | Function in Alignment & Assessment | Example Source/Application |
|---|---|---|---|
| Value Consolidation Mechanisms [58] | Conceptual Framework | Mechanisms (e.g., bridging, demarcating, coupling) to align stakeholder cognition, goals, and practices in collaborative settings. | Used to analyze multi-stakeholder circular economy collaborations; applicable to ERA problem formulation workshops. |
| Cumulative Distribution Functions (CDFs) | Statistical Tool | Quantifies the probability and magnitude of exceeding defined risk or benefit thresholds for ecosystem service supply. | Core of the ERA-ES methodology for comparing management scenarios [60]. |
| Evolutionary Game Theory Model | Analytical Model | Simulates the dynamic, strategic interactions among stakeholders to predict stable outcomes and test policy interventions. | Applied to land-use conflict in Caohai Reserve; identified critical penalty and subsidy levels [59]. |
| Structured Stakeholder Survey | Data Collection Instrument | Collects quantifiable data on stakeholder preferences, costs, benefits, and potential behaviors to parameterize models. | 392-survey instrument used to parameterize payoff matrices in game model [59]. |
| Sediment Denitrification Rate Model | Biogeochemical Model | A specific stressor-response model linking a human activity (e.g., offshore construction) to a regulating ecosystem service endpoint. | Multiple linear regression model (Denitrification = f(TOM, FSF)) used in offshore wind farm ERA-ES [60]. |
| Semi-Structured Interview Guides | Qualitative Data Tool | Elicits in-depth understanding of stakeholder values, cognitive models, and perceived barriers to alignment. | Used alongside surveys in case studies to understand institutional logics [58]. |
Aligning divergent stakeholder interests with ecological protection values is not a peripheral concern but the very core of effective ecological risk assessment. Problem formulation, as emphasized by the EPA, is an iterative dialogue between risk assessors, managers, and stakeholders [25] [12]. By systematically addressing cognitive, goal, and practice misalignments through structured frameworks, and by employing advanced methodologies like ERA-ES and evolutionary game theory, researchers can transform this dialogue from a source of conflict into an engine for robust, legitimate, and impactful science.
The integration of ecosystem service valuation provides a common currency—quantifiable risks and benefits to human well-being—that can resonate across diverse stakeholder logics. Simultaneously, game-theoretic analysis offers a predictive lens to understand stakeholder behavior and design incentive systems that make cooperative, protective strategies the rational choice. For scientists and drug development professionals, mastering these integrative tools is essential for formulating research questions that are not only ecologically relevant but also societally actionable, thereby ensuring that environmental risk assessments fulfill their ultimate purpose: informing decisions that sustain both ecological and human communities.
Adapting Problem Formulation for Cumulative Risk Assessments and Multiple Stressors
Problem formulation represents the critical, front-end planning phase of ecological risk assessment (ERA) that determines the scope, depth, and focus of the entire analysis [61]. Originally formalized within ERA to pragmatically constrain and focus assessments on essential management questions, its systematic approach has become indispensable for addressing the inherent complexity of cumulative risk assessments (CRAs) and multiple stressors evaluations [61]. CRAs are defined by their explicit consideration of combined threats to ecological health from exposures to multiple chemical, biological, and physical stressors, often interacting with modulating factors such as habitat alteration or climatic conditions [61]. In the context of a broader thesis on problem formulation in ERA research, this whitepaper contends that adapting and rigorously applying problem formulation is not merely a preliminary step but the central, governing process that enables scientifically defensible and resource-efficient assessment of cumulative effects. This guide details the frameworks, experimental protocols, and analytical tools required for its effective implementation by researchers and environmental professionals.
Core Frameworks and Regulatory Context
Modern problem formulation for CRAs is guided by established and emerging frameworks that provide structured pathways from initial planning to analysis. The central role of problem formulation has been cemented by its integration into major regulatory and scientific guidelines.
Table 1: Key Frameworks for Problem Formulation in Cumulative Risk Assessment
| Framework Name | Primary Source | Core Purpose | Key Innovations |
|---|---|---|---|
| EPA CRA Planning & Problem Formulation Guidelines | U.S. EPA (2025) [47] | To provide a uniform, flexible approach for planning CRAs and developing an analysis plan. | Updates and supersedes 1997 guidance; emphasizes stakeholder involvement, conceptual models, and data quality objectives from the outset [47]. |
| Multiple Stressors Assessment Framework (MSAF) | Lima et al. (2023) [62] | To provide a roadmap for assessing and managing multiple stressors in ecosystems, linking science to adaptive management. | Seven-step process from problem formulation to management recommendations; emphasizes iterative hypothesis testing and model validation [62]. |
| RISK21 Framework | Solomon et al. (2016) [61] | To streamline and focus risk assessment for combined exposures to chemicals and other stressors. | Introduces "modulating factors" (ModFs) for non-chemical stressors; uses problem formulation to optimize resource use in complex assessments [61]. |
A significant evolution in the field is the shift from viewing problem formulation as a simple scoping exercise to treating it as a foundational, iterative process. The U.S. Environmental Protection Agency's (EPA) 2025 guidelines formally institutionalize this by detailing how problem formulation establishes the assessment's purpose, bounds, conceptual models, and analysis plan [47]. Concurrently, the Interim Framework for Advancing Consideration of Cumulative Impacts (EPA, 2024) underscores the growing imperative to evaluate how multiple environmental burdens are distributed across communities and ecosystems [63]. These frameworks collectively mandate that problem formulation explicitly defines the stressors of concern, the ecological receptors (e.g., keystone species, critical functions), and the specific assessment endpoints (measurable ecological attributes) [62].
Implementation Protocol: The Problem Formulation Workflow
Implementing problem formulation is a multi-stage, collaborative process. The following protocol synthesizes the required steps from the reviewed frameworks into a actionable workflow for researchers [61] [47] [62].
Phase 1: Assessment Trigger & Preliminary Screening
- Input: Regulatory need, community concern, monitoring data indicating degradation, or a planned management action.
- Action: Conduct a preliminary literature and data review to identify potential stressors and receptors in the system. Engage initial stakeholders (e.g., resource managers, community representatives) to understand core concerns.
- Output: A brief statement of the perceived problem and a decision on whether to proceed with a formal CRA.
Phase 2: Definitive Problem Formulation This is the core analytical phase, consisting of four concurrent activities.
- Define Objectives & Scope: Precisely state the risk management goals and the scientific questions the assessment must answer. Define spatial boundaries (e.g., watershed, habitat patch), temporal scales (e.g., acute vs. chronic, seasonal), and the range of stressors to be included [62].
- Develop Conceptual Models: Create diagrammatic representations of the system.
- Stressor-Exposure Model: Illustrates the sources of stressors, their release and transport pathways, and how they co-occur in space and time to reach ecological receptors [61].
- Stressor-Ecological Response Model: Depicts the hypothesized cause-effect relationships between exposure and assessment endpoints, including potential interactions (additive, synergistic, antagonistic) between stressors and the influence of modulating factors [62].
- Select Assessment Endpoints & Metrics: Choose specific, measurable ecological entities (e.g., juvenile salmonid survival) and their attributes (e.g., growth rate, reproductive success) that are valued and susceptible. Identify associated quantitative measurement endpoints (e.g., biomarker response, population abundance).
- Develop an Analysis Plan & Data Quality Objectives: Specify the data needed, the methods for collection and analysis (e.g., experimental designs, statistical models), and the quality criteria data must meet. Plan for stakeholder review at this stage [47].
Phase 3: Plan for Iteration
- Action: Recognize problem formulation as a "living" process. The analysis plan should include checkpoints to refine hypotheses, conceptual models, and methods based on interim findings, aligning with adaptive monitoring principles [62].
Cumulative Risk Assessment Problem Formulation Workflow [61] [47] [62]
Experimental Design & Data Analysis for Multiple Stressors
A robust analysis plan from the problem formulation phase must guide empirical work. Research to evaluate multiple stressor effects requires designs that can disentangle interactions.
Key Experimental Designs:
- Full Factorial Designs: The most rigorous approach, exposing test systems to all possible combinations of stressor levels (e.g., low/medium/high temperature x low/medium/high contaminant concentration). This allows direct statistical quantification of interaction effects (synergy, antagonism) but becomes logistically challenging with more than 2-3 stressors [62].
- Stressor Gradient or Gradient Design: Leverages natural environmental gradients (e.g., downstream pollution gradient combined with land-use change). Statistical models (e.g., generalized additive models) are used to partition the variance in ecological response attributed to each stressor and their interaction [62].
- Before-After-Control-Impact (BACI) with Multiple Stressors: Useful when a new stressor is introduced (e.g., dam removal) into a system with existing stressors. Compares impacted and control sites before and after the new stressor's introduction to isolate its effect within the cumulative context.
Data Analysis & Visualization: The analysis must progress from descriptive summaries to inferential modeling of interactions [64].
Table 2: Summary Statistics for Comparing Ecological Responses Across Stressor Conditions
| Stressor Condition Group | Sample Size (n) | Mean Response | Std. Deviation | Median Response | Interquartile Range (IQR) |
|---|---|---|---|---|---|
| Control (No stressors) | 12 | 100.0 | 8.5 | 101.2 | 12.3 |
| Stressor A Only | 12 | 82.4 | 10.1 | 81.5 | 14.7 |
| Stressor B Only | 12 | 85.7 | 9.3 | 86.1 | 11.8 |
| Stressors A & B Combined | 12 | 60.2 | 15.6 | 58.9 | 22.4 |
| Difference (A&B vs. Control) | - | -39.8 | n/a | -42.3 | n/a |
Note: Hypothetical data for a population growth rate endpoint. The large negative difference for the combined group suggests a potential interaction beyond additive effects. Standard deviation and IQR are not calculated for the difference [64].
Statistical modeling is essential to test hypotheses from the conceptual models. Key approaches include:
- Linear & Generalized Linear Models (LM/GLM): To test for significant main and interaction effects of stressors.
- Variance Partitioning: To quantify the proportion of response variance explained by each stressor, their interaction, and covariates.
- Causal Modeling/Bayesian Networks: To evaluate the viability of the hypothesized pathways in the conceptual model, especially where direct experimentation is impossible [62].
Data visualization should facilitate comparison across groups. Side-by-side boxplots are highly effective for showing the distribution (median, quartiles, outliers) of a quantitative response (e.g., species richness) across multiple stressor combination groups, clearly illustrating central tendency and spread [64].
The Multiple Stressors Assessment Framework (MSAF) in Practice
The MSAF provides a detailed, seven-step roadmap translating problem formulation into actionable science [62]. Its steps are highly relevant to ecological risk assessment research.
Multiple Stressors Assessment Framework (MSAF) Steps [62]
A critical research gap identified within frameworks like the MSAF is the disconnect between the assessment of combined effects and the implementation of management practices [62]. Therefore, a core output of problem formulation must be a plan for how assessment results will directly inform adaptive management choices, such as prioritizing which stressor to mitigate first based on its interaction potential.
The Scientist's Toolkit: Essential Research Reagents and Materials
Conducting research informed by rigorous problem formulation requires specialized tools and materials.
Table 3: Key Research Reagent Solutions for Multiple Stressor Experiments
| Category | Item/Solution | Function in CRA Research |
|---|---|---|
| Stressor Simulation | Standardized Toxicant Stocks (e.g., CuCl₂, pesticide formulations) | To provide precise, reproducible chemical exposure concentrations in laboratory or mesocosm studies. |
| Environmental Chambers | To accurately control and manipulate physical stressors like temperature, pH, or light regimes in combination with chemical exposures. | |
| Biological Response | Viability/Cytotoxicity Assay Kits (e.g., MTT, AlamarBlue) | To measure cell- or tissue-level health of model organisms or primary cultures under multiple stressor conditions. |
| qPCR Master Mixes & Primers | To quantify transcriptional changes in genes associated with specific stress response pathways (e.g., heat shock, oxidative stress, detoxification). | |
| ELISA Kits for Stress Proteins (e.g., HSP70, CYP450 enzymes) | To measure protein-level biomarker responses, indicating physiological adaptation or damage. | |
| Ecological Endpoint | Standardized Benthic Macroinvertebrate Sampling Kits (D-net, kick-net, sorting trays) | To collect functional community data (structure and abundance) for assessing in-situ responses to multiple stressors in freshwater systems. |
| Chlorophyll-a Extraction & Analysis Kit | To measure algal biomass as an endpoint for eutrophication studies, often interacting with toxicants. | |
| Data Analysis | Statistical Software (e.g., R with vegan, lme4, mgcv packages) |
To perform multivariate analysis, model stressor interactions (GLMs, GAMs), and conduct variance partitioning. |
| Geospatial Analysis Software (e.g., QGIS, ArcGIS) | To map co-occurrence of stressors and ecological conditions, a key component of spatial problem formulation. |
Adapting problem formulation for cumulative risk assessments is an exercise in disciplined, upfront planning that pays substantial dividends in scientific clarity and regulatory relevance. By systematically defining objectives, scope, conceptual models, and analysis plans—as mandated by modern frameworks like the EPA's 2025 Guidelines and the MSAF—researchers can transform the daunting complexity of multiple stressors into a tractable series of scientific questions. This guide underscores that the most critical investment in CRA is not in the volume of data collected, but in the intellectual rigor of the problem formulation phase. It is this phase that ensures the resulting assessment is focused, efficient, and ultimately capable of informing the management actions necessary to protect ecological systems from the interconnected threats of the Anthropocene. Future research must continue to bridge the gap between interaction assessment and practical mitigation, with problem formulation serving as the essential linchpin.
Optimizing Resource Allocation for Tiered Assessments and Defining Stopping Rules
This whitepaper presents a structured framework for implementing tiered assessments within ecological risk assessment (ERA), with a focus on optimizing resource allocation and establishing evidence-based stopping rules. Framed within the critical context of problem formulation—the foundational phase that determines an ERA's scope, endpoints, and methodology—the guide details how a phased, tiered approach enhances scientific rigor and regulatory efficiency [2] [3] [4]. By aligning assessment complexity with the specificity of management goals and the tolerance for uncertainty, this model ensures that scientific and financial resources are deployed judiciously. The incorporation of predefined stopping rules at each tier provides a clear, objective mechanism to conclude assessments when sufficient evidence for decision-making has been obtained, thereby preventing unnecessary expenditure of resources. Designed for researchers, scientists, and regulatory professionals, this technical guide bridges conceptual frameworks from educational tiered systems with the rigorous demands of environmental and pharmaceutical risk science [65] [66] [50].
The initial phase of an Ecological Risk Assessment (ERA), termed problem formulation, is a collaborative planning dialogue between risk assessors and risk managers [2] [3]. Its primary function is to transform broad management goals into a specific, actionable scientific investigation. This phase articulates the assessment's purpose, defines the problem, and establishes the plan for analysis and risk characterization [3] [4]. The agreements reached during problem formulation directly determine the scope, focus, and complexity of the entire assessment, which in turn dictates resource needs in terms of data, expertise, time, and finances [2].
A poorly executed problem formulation can lead to assessments that are misaligned with decision-making needs, resulting in wasted resources, prolonged timelines, and increased uncertainty [4] [50]. Conversely, a robust problem formulation explicitly considers the uncertainty tolerance within a decision context and provides the ideal foundation for implementing a tiered assessment strategy [2]. One advocated approach within problem formulation is to establish tiered evaluations that begin with simple, conservative decision criteria and proceed sequentially to more complex analyses only as needed [2]. This paper operationalizes this approach, providing a methodological guide for optimizing resources through tiered assessments and defining the stopping rules that govern progression between tiers.
Core Concepts: Tiered Structures and Resource Allocation Principles
A tiered assessment is a systematic, multi-level approach where the initial tier employs conservative, screening-level models and data. Subsequent tiers are activated only if initial analysis indicates potential risk, with each tier incorporating more sophisticated, site-specific, and resource-intensive methods [2]. This structure is analogous to frameworks like the Multi-Tiered System of Supports (MTSS) in education, where interventions escalate in intensity based on continuous data monitoring of student need [66] [67] [68].
Table 1: Tiered Assessment Framework for Ecological Risk
| Tier | Objective | Methodology & Complexity | Resource Intensity | Decision Outcome |
|---|---|---|---|---|
| Tier 1: Screening | Identify substances/scenarios posing negligible risk under conservative assumptions. | Standardized models (e.g., EPA screening models), generic exposure parameters, published toxicity benchmarks (LC50/NOAEC) [2]. | Low (Minimal data needs, high use of existing tools and defaults). | Stop: No potential risk identified. Proceed: Potential risk warrants refined analysis. |
| Tier 2: Refined Analysis | Quantify risk more accurately for substances/scenarios flagged in Tier 1. | Site-specific exposure modeling, refined environmental fate data, species-specific toxicity testing [2] [3]. | Moderate to High (Requires new data generation, advanced modeling expertise). | Stop: Risk is acceptable or managed. Proceed: Risk is potentially unacceptable and requires precise characterization. |
| Tier 3: Comprehensive Risk Characterization | Provide high-resolution risk estimate for definitive risk management decisions. | Probabilistic modeling, field validation studies, population- or ecosystem-level effects assessment [3] [4]. | High (Extensive, long-term studies requiring significant expertise and funding). | Stop: Risk is definitively characterized for management action. |
The principle of resource allocation in this context is one of progressive investment. The majority of assessments are resolved at Tier 1 with minimal resource expenditure, reserving more intensive resources (Tiers 2 and 3) for the minority of cases where potential risk is indicated [2] [68]. This is summarized in the table below.
Table 2: Resource Allocation Profile Across Assessment Tiers
| Resource Type | Tier 1 (Screening) | Tier 2 (Refined) | Tier 3 (Comprehensive) |
|---|---|---|---|
| Financial Cost | Low | Moderate | High |
| Time to Completion | Weeks to Months | Months to a Year | One to Several Years |
| Data Requirements | Existing, generic, or estimated data. | New, substance- or site-specific laboratory & field data. | Extensive, multi-endpoint field and population-level data. |
| Personnel Expertise | Standard regulatory/risk science. | Specialized toxicology, modeling, and ecology. | Advanced expertise in multiple disciplines (ecotoxicology, statistics, ecosystem modeling). |
| Proportion of Assessments | High (~70-80%) | Moderate (~15-25%) | Low (~5-10%) |
Methodology: Integrating Tiered Assessment into Problem Formulation
The integration of a tiered approach begins during the problem formulation phase. The process, derived from EPA guidelines and international expert consensus, involves the steps below [2] [3] [4].
Step 1: Define Management Goals & Assessment Endpoints Risk managers articulate goals (e.g., "protect aquatic community sustainability"). Assessors translate these into concrete assessment endpoints (e.g., "reproduction in freshwater fish populations") [2] [3]. The specificity required informs the necessary tier.
Step 2: Develop a Conceptual Model A diagrammatic conceptual model illustrates hypothesized relationships between stressors, exposure pathways, and assessment endpoints [3] [4]. This model identifies key variables to be measured and potential points of uncertainty.
Step 3: Select an Analysis Plan & Define Stopping Rules This is the critical step for tiering. The team selects a Tier 1 methodology and, crucially, pre-defines the quantitative or qualitative criteria (stopping rules) that will determine the outcome of that tier.
- Stopping Rule Example (Tier 1): If the Estimated Exposure Concentration (EEC) is less than the Level of Concern (LOC), such as 1/10th of the acute LC50 for the most sensitive species, the assessment stops with a conclusion of "negligible risk" [2]. If the EEC exceeds the LOC, the assessment proceeds to Tier 2.
Step 4: Iterative Implementation Tiers are executed sequentially. The stopping rules from one tier trigger the pre-planned, more refined analysis of the next tier, ensuring the assessment remains focused and efficient.
Tiered Assessment Workflow with Integrated Stopping Rules
Defining and Applying Stopping Rules
Stopping rules are pre-agreed criteria that determine whether an assessment can conclude at its current tier or must proceed to a more complex one. They are the operational mechanism that ensures resource efficiency.
Characteristics of Effective Stopping Rules:
- Predefined: Established during problem formulation, not ad-hoc during analysis.
- Objective: Based on quantitative thresholds (e.g., Hazard Quotients, statistical significance) or unambiguous qualitative criteria.
- Conservative: Early tier rules are health-protective, erring on the side of proceeding to a more refined tier if data is ambiguous.
- Decision-Relevant: Directly linked to the risk management goals defined in problem formulation [2] [3].
Table 3: Examples of Stopping Rules by Assessment Tier
| Tier | Example Stopping Rule (Quantitative) | Supporting Data & Action |
|---|---|---|
| Tier 1 | Hazard Quotient (HQ) < 0.1. HQ = (Estimated Exposure Concentration) / (Toxicity Benchmark). | Use conservative exposure estimates and lowest available toxicity benchmark (e.g., LC50). If HQ < 0.1, STOP. If HQ ≥ 0.1, proceed to Tier 2 [2]. |
| Tier 2 | Risk is below a pre-defined acceptable threshold (e.g., < 1 in 10,000 added effect) with reasonable certainty using refined data. | Use species-specific chronic toxicity data (NOAEC/LOAEC) and site-specific exposure modeling. If risk is characterized as acceptable, STOP. If uncertainty remains high, proceed to Tier 3. |
| Tier 3 | Statistical power of study > 80% to detect a specified effect size relevant to the assessment endpoint. | Conduct a field or mesocosm study with sufficient replication and duration. Once the study meets its pre-specified power and objectives, STOP and make final management decision [4]. |
Logic of Decision-Making Using a Stopping Rule
Experimental Protocols for Key Tiered Assessments
The following protocols outline core experimental approaches corresponding to successive tiers of ecological risk assessment for a chemical stressor.
Protocol 1: Tier 1 – Standardized Aquatic Toxicity Screening
- Objective: Generate or obtain baseline acute toxicity data for regulatory screening.
- Method: Follow OECD Test Guideline 203 (Fish, Acute Toxicity Test) or equivalent [2].
- Procedure:
- Expose groups of a standard test species (e.g., Daphnia magna, fathead minnow) to a minimum of five concentrations of the test substance in a static or flow-through system.
- Maintain a control group in substance-free medium.
- Monitor mortality at 24, 48, 72, and 96 hours.
- Use probit analysis or linear interpolation to calculate the LC50 (median lethal concentration) with 95% confidence intervals.
- Data Application: The lowest 96-h LC50 from a suite of standard tests becomes the benchmark for calculating the Tier 1 Hazard Quotient [2].
Protocol 2: Tier 2 – Chronic Endpoint and Species-Sensitivity Distribution (SSD) Development
- Objective: Refine toxicity estimates for more realistic risk characterization.
- Method: Conduct chronic life-cycle or early-life-stage tests and construct an SSD.
- Procedure:
- Perform chronic toxicity tests (e.g., OECD TG 210, Fish Early-Life Stage) for 3-5 additional ecologically relevant species.
- Derive chronic endpoints such as the No Observed Adverse Effect Concentration (NOAEC) or EC10.
- Fit a statistical distribution (e.g., log-normal) to the chronic endpoints for all tested species.
- Calculate a HC5 (Hazardous Concentration for 5% of species) from the SSD.
- Data Application: The HC5 provides a protective chronic threshold for refined risk assessment, replacing the conservative acute LC50 from Tier 1.
Protocol 3: Tier 3 – Model Ecosystem (Mesocosm) Study
- Objective: Assess population- and community-level effects under semi-natural conditions.
- Method: Establish replicated outdoor pond mesocosms.
- Procedure:
- Establish 12-20 replicated mesocosms with natural sediment, macrophytes, and invertebrate/plankton communities.
- Introduce a fish population (e.g., bluegill sunfish).
- Apply a gradient of the test substance (e.g., 4 concentrations plus controls) to triplicate or quadrupicate mesocosms.
- Monitor key endpoints (e.g., insect emergence, fish growth/reproduction, phytoplankton diversity) over a full seasonal cycle.
- Use multivariate statistics to detect community-level effects and determine a No Observed Effect Concentration (NOECcommunity).
- Data Application: The NOECcommunity provides a high-confidence, ecologically relevant endpoint for final risk management decisions [4].
Applications and The Scientist's Toolkit
The tiered approach is applicable across regulatory and research contexts, from pesticide approval [2] and contaminated site remediation [50] to the assessment of genetically modified organisms [4]. Its utility in pharmaceutical development lies in structuring environmental risk assessment (ERA) for APIs, where a tiered strategy is mandated by guidelines such as ICH E6.
Table 4: The Scientist's Toolkit for Tiered Ecological Risk Assessment
| Tool / Reagent Solution | Primary Function | Typical Tier of Use |
|---|---|---|
| Standard Test Organisms (e.g., Daphnia magna, Fathead minnow, Algae) | Surrogate species representing broad taxonomic groups for generating comparable toxicity benchmarks [2]. | Tier 1, Tier 2 |
| EPA Exposure Models (e.g., PRZM, EXAMS, T-REX) | Predictive models for estimating environmental concentration (EEC) of chemicals in water, soil, and air based on use patterns and properties [2]. | Tier 1, Tier 2 |
| Toxicity Reference Databases (e.g., ECOTOX from EPA) | Curated databases of published toxicity values for thousands of chemicals and species, supporting screening and SSD development. | Tier 1, Tier 2 |
| Species-Sensitivity Distribution (SSD) Software (e.g., ETX 2.0, SSD Master) | Statistical packages for fitting distributions to toxicity data and deriving protective concentration thresholds (e.g., HC5). | Tier 2 |
| Mesocosm or Microcosm Test Systems | Controlled outdoor or indoor replicated ecosystem models for studying complex ecological interactions and effects. | Tier 3 |
| Probabilistic Risk Assessment Software (e.g., @RISK, Crystal Ball) | Tools for propagating variability and uncertainty in exposure and effects data to generate risk probability distributions. | Tier 3 |
| Formative Assessment & Progress Monitoring Protocols | Structured, short-cycle data reviews to monitor assessment progress and inform the need to adjust tiers or apply stopping rules [67]. | All Tiers |
A tiered assessment framework, meticulously planned during the problem formulation phase of an ERA, represents a paradigm of scientific and fiscal efficiency. By matching the intensity of the assessment to the specific demands of the case, it optimizes the allocation of finite resources. The explicit definition of stopping rules is the critical innovation that operationalizes this efficiency, providing objective off-ramps to conclude assessments the moment they have met their decision-making purpose. For the regulatory scientist and drug developer, adopting this structured approach minimizes unnecessary testing, accelerates timelines, and directs advanced scientific resources toward the complex problems where they are truly needed, ultimately leading to more robust, defensible, and timely risk management decisions.
The integration of tiered thinking and stopping rules transforms risk assessment from a linear, formulaic process into a dynamic, resource-aware scientific investigation.
Ensuring Quality and Connectivity: Validation, Review, and Cross-Disciplinary Alignment
Internal and External Peer Review Strategies for Problem Formulation Outputs
Problem formulation (PF) is the foundational and arguably most consequential phase of ecological risk assessment (ERA). It establishes the assessment's scope, objectives, conceptual models, and analysis plan, thereby directing all subsequent scientific and technical work [25] [47]. Framed within a broader thesis on enhancing ecological risk assessment research, this guide addresses the formal strategies required to ensure the robustness, relevance, and defensibility of PF outputs through structured internal and external peer review.
The U.S. Environmental Protection Agency (EPA) emphasizes that PF is not a solitary scientific exercise but a collaborative interface involving risk assessors, risk managers, and interested parties. This collaboration is essential for determining the assessment's boundaries, selecting appropriate ecological assessment endpoints, and ensuring the final product effectively supports environmental decision-making [25]. In complex assessments, such as those evaluating cumulative risks from multiple stressors, a rigorous PF phase is critical for navigating scientific complexity and stakeholder diversity [47].
Peer review serves as the essential quality control mechanism for PF outputs. It subjects the proposed assessment design, assumptions, and planned methodologies to expert scrutiny before significant resources are committed to the analysis phase. For regulatory agencies like the EPA, peer review of major scientific assessments is a mandated process to enhance objectivity, transparency, and scientific credibility [69] [70]. Effective peer review strategies for PF must therefore be meticulously planned and executed, involving both internal cross-disciplinary teams and external independent experts. This guide provides a technical framework for implementing these strategies, integrating current guidelines and emerging scientific practices to elevate the quality and utility of ecological risk assessments.
Foundational Principles of Peer Review for Problem Formulation
Peer review of PF outputs must be guided by core principles aligned with both scientific integrity and the pragmatic needs of risk management. The OMB Proposed Risk Assessment Bulletin underscores that the purpose of risk assessment is to synthesize scientific information to inform decisions, necessitating processes that are transparent, objective, and of high technical quality [69]. For PF, this translates into several key principles:
- Fitness for Purpose: The review must evaluate whether the proposed assessment design is appropriately scaled to answer the specific risk management questions driving the assessment. A PF for a site-specific retrospective assessment will differ fundamentally from one for a broad, prospective chemical registration.
- Conceptual Model Soundness: Reviewers must examine the logic and completeness of the conceptual model, which describes the hypothesized relationships between stressors, ecological receptors, exposure pathways, and effects [47] [71]. The model should be plausible, inclusive of key ecosystem processes, and clearly illustrate potential direct and indirect effects.
- Endpoint Relevance and Measurability: A central task of PF is selecting assessment endpoints (e.g., population stability of a key species, ecosystem service provision). Peer review must judge whether these endpoints are ecologically relevant, socially valued, and technically measurable through available or obtainable data [60] [71].
- Analysis Plan Feasibility: The proposed methodology for exposure and effects analysis must be critiqued for its scientific adequacy, statistical power, and practicality. The plan should explicitly address how variability, uncertainty, and the potential for cumulative effects will be characterized [47].
- Stakeholder Inclusivity and Transparency: The PF process should demonstrate meaningful engagement with relevant stakeholders, including risk managers, regulated entities, communities, and Tribal nations. The review evaluates whether their concerns and knowledge have been adequately incorporated and if the process is transparent [25].
Internal Peer Review Strategies
Internal peer review is a collaborative, iterative process conducted within the organization responsible for the assessment before seeking external expertise. Its goal is to strengthen the foundational document and identify potential issues early.
Objectives and Composition of the Internal Review Team
The primary objective is to ensure the PF output is logically coherent, methodologically sound, and fully aligned with organizational guidelines and the assessment's regulatory or management goals [25]. An effective internal review team should be multidisciplinary, including:
- ERA Methodologists: Experts in risk assessment frameworks and models.
- Ecological Specialists: Scientists with expertise in relevant taxa, ecosystems, or processes (e.g., population dynamics, ecosystem services) [71].
- Statisticians and Modelers: To evaluate data quality objectives and analysis plans.
- Risk Managers: To ensure the PF addresses the core decision-making needs.
- Quality Assurance Staff: To verify adherence to standard operating procedures.
The Internal Review Workflow and Toolkit
A structured workflow is essential for an effective internal review. The following diagram and accompanying toolkit outline this process.
Table 1: Internal Review Toolkit for Problem Formulation Outputs
| Review Element | Key Questions for Reviewers | Supporting Guidance/Documents |
|---|---|---|
| Problem Scope & Goals | Are management goals and decision context clearly stated? Is the spatial/temporal scale appropriate? | EPA Guidelines [25], CRA Guidelines [47] |
| Conceptual Model | Are all relevant stressors, exposure pathways, and ecological receptors included? Are key relationships and feedback loops depicted? | Diagram from PF output; Literature on system ecology [71] |
| Assessment Endpoints | Do endpoints directly link to management goals? Are they ecologically relevant and technically measurable? | Ecosystem Services frameworks [60]; Wildlife ERA challenges [71] |
| Analysis Plan | Are the proposed methods (e.g., models, metrics) adequate to estimate exposure and effects? Are data quality objectives defined? | White papers on advanced methods (e.g., dose addition) [70] |
| Uncertainty & Variability | Does the plan identify major sources of uncertainty and propose methods to characterize them? | CRA Guidelines on uncertainty analysis [47] |
| Stakeholder Input | Is there evidence that stakeholder concerns were solicited and considered in the PF? | EPA Guidelines on interaction [25] |
External Peer Review Strategies
External peer review provides independent, expert validation of the PF's scientific and technical basis. It is often a required step for assessments supporting significant regulatory decisions [69] [70].
Planning and Scoping the External Review
The scope of the external review should be precisely defined. For PF, the charge to reviewers typically focuses on the scientific adequacy and feasibility of the conceptual model, assessment endpoints, and analysis plan, rather than on the risk management goals themselves [72]. Recent EPA solicitations for peer reviewers, such as for the risk evaluation of octamethylcyclotetrasiloxane (D4), specify needed expertise areas (e.g., hazard identification, bioaccumulation, ecological risk assessment), providing a model for crafting a targeted charge [72].
The External Review Process
A robust external review process often combines written comments with a public meeting. The following diagram illustrates a typical federal agency process.
Table 2: Key Elements of External Peer Review for Problem Formulation
| Element | Description | Example from Recent Practice |
|---|---|---|
| Reviewer Selection | Experts are selected for specific, declared areas of expertise, often through public nomination. Conflict of interest checks are mandatory. | EPA sought experts in PBPK modeling, bioaccumulation, and ecological risk for D4 review [72]. |
| Review Materials | Provided to panel and public, including the PF document, supporting science, public comments, and a clear charge questions. | EPA releases draft assessments and modeling code for public comment prior to peer review [70]. |
| Public Engagement | Includes an open comment period on the draft and a public meeting where the panel deliberates. | NASEM reviews for EPA (e.g., Formaldehyde Assessment) are public processes [70]. |
| Panel Deliberation | Panel discusses charge questions, often in a public teleconference or meeting, to develop consensus advice. | The SACC conducts public virtual meetings to peer review EPA risk evaluations [72]. |
| Panel Report | Documents the consensus (or divergent) views of the panel on the charge questions, providing specific recommendations. | NASEM publishes final reports with recommendations for improving assessments [70]. |
| Agency Response | The assessing agency must publicly respond to the panel's report, explaining how comments were addressed. | Implied in EPA's peer review policies and evident in final assessment revisions. |
Quantitative Frameworks and Experimental Protocols for PF Validation
Integrating quantitative and experimental approaches into PF can generate data to test conceptual models and validate assessment endpoints, making the PF output itself more robust and reviewable.
Quantitative Comparison of ERA Approaches
The field of ERA is evolving from chemical-centric, single-species approaches to more holistic frameworks that incorporate ecosystem services and population-level effects. The table below contrasts these paradigms, highlighting data needs and review implications.
Table 3: Quantitative Comparison of Traditional and Advanced ERA Problem Formulation Paradigms
| Paradigm Characteristic | Traditional Chemical ERA | Advanced ERA (Ecosystem Services & Population Focus) | Data & Review Implication |
|---|---|---|---|
| Primary Assessment Endpoint | Survival/growth/reproduction of standard test species (e.g., Daphnia, algae) [60]. | Supply of specific ecosystem services (e.g., waste remediation) [60] or population viability [71]. | Requires ecological production functions or population models. Review must assess endpoint quantifiability. |
| Effect Metric | Toxicity thresholds (e.g., LC50, NOEC). | Probability and magnitude of exceeding benefit/risk thresholds for service supply [60]. | Requires probabilistic exposure and effects distributions. Review focuses on threshold justification and distribution fitting. |
| Spatial Component | Often implicit or limited (e.g., mixing zone). | Explicit; incorporates landscape heterogeneity and species movement [71]. | Requires GIS data and spatially explicit models. Review assesses model realism and scale. |
| Stressors Considered | Primarily a single chemical or simple mixture. | Multiple chemical and non-chemical stressors (e.g., habitat loss, climate) [47] [71]. | Requires complex conceptual models and integrated analysis plans. Review judges model completeness. |
| Uncertainty Handling | Often deterministic, using safety factors. | Explicit probabilistic analysis (e.g., Monte Carlo, Bayesian networks) [71]. | Requires sophisticated uncertainty analysis. Review evaluates uncertainty characterization adequacy. |
Detailed Experimental Protocol: Validating an Ecosystem Service Endpoint
The following protocol, based on the ERA-ES (Ecosystem Services) method [60], provides a template for generating data to support a PF centered on a regulating ecosystem service like waste remediation (e.g., nutrient processing).
Protocol Title: Quantifying Risks and Benefits to Sediment Denitrification Service from Offshore Infrastructure.
1. Objective: To measure changes in the ecosystem service of waste remediation (via sediment denitrification) caused by an offshore wind farm (OWF) to validate its selection as a quantitative assessment endpoint in PF.
2. Hypothesis: OWF infrastructure alters sediment characteristics (increasing Total Organic Matter - TOM), leading to an increase in denitrification rate, representing a quantifiable benefit to the waste remediation service.
3. Materials & Field Site:
- Study Site: Belgian Part of the North Sea, within and adjacent to an operational OWF [60].
- Control Sites: Representative areas outside OWF influence with similar baseline bathymetry and sediment type.
- Sampling Equipment: Van Veen grab or box corer for sediment collection, Niskin bottles for water, GPS.
4. Experimental Procedure:
- Step 1 - Site Characterization & Sampling: Conduct pre- and post-construction surveys. Collect sediment cores (for TOM, grain size, denitrification assay) and water samples (for nutrient profiles) from a stratified random design within OWF and control areas.
- Step 2 - Sediment Analysis: Measure Total Organic Matter (TOM) via loss-on-ignition and Fine Sediment Fraction (FSF) via laser diffraction. These are predictor variables [60].
- Step 3 - Denitrification Rate Measurement: Process sub-cores in a laboratory within 24 hours. Use the isotope pairing technique (¹⁵N-NO₃ tracer) in sealed incubations to measure direct denitrification rates (D₁₄) [60].
- Step 4 - Model Development: Fit a multiple linear regression model (e.g., Denitrification Rate = β₀ + β₁TOM + β₂FSF) using baseline control data to establish the natural relationship [60].
- Step 5 - Impact Quantification: Apply the regression model to post-construction TOM and FSF data from OWF areas. Compare predicted vs. measured denitrification rates. Statistically compare OWF and control site parameters using ANOVA or similar.
5. Data Analysis & Endpoint Validation:
- Calculate the probability distribution of denitrification rates for both OWF and baseline conditions.
- Define a benefit threshold (e.g., 90th percentile of baseline distribution). Calculate the probability and magnitude of exceeding this threshold in the OWF scenario [60].
- This quantitative output directly validates the selection of "waste remediation service" as an endpoint and provides the specific metric (probability of benefit exceedance) for the analysis plan.
6. Workflow Visualization: The integrated workflow from hypothesis to quantitative endpoint is shown below.
The Scientist's Toolkit: Key Research Reagents & Materials
Table 4: Essential Research Reagents and Materials for ERA-ES Validation Protocol
| Item | Function in Protocol | Specification/Notes |
|---|---|---|
| Van Veen Grab Sampler | Collects undisturbed surface sediment samples from the seabed. | Stainless steel; various sizes (e.g., 5L) for adequate sample volume. |
| ¹⁵N-Nitrate Tracer (K¹⁵NO₃ or Na¹⁵NO₃) | Isotopically labeled substrate to measure denitrification rates via isotope pairing. | ≥98 atom% ¹⁵N purity. Critical for accurate mass spectrometry. |
| Exetainer Vials or Similar | Glass vials with septum for anaerobic incubation of sediment slurries. | 12 mL, pre-flushed with He or Ar to create anoxic conditions. |
| Elemental Analyzer coupled to Isotope Ratio Mass Spectrometer (EA-IRMS) | Measures the ²⁸N₂:²⁹N₂:³⁰N₂ ratio in incubation headspace to calculate denitrification from the ¹⁵N tracer. | High-precision instrument required for detecting isotopic enrichment. |
| Muffle Furnace | Measures Total Organic Matter (TOM) via loss-on-ignition. | Capable of maintaining 550°C ± 25°C for 4-6 hours. |
| Laser Diffraction Particle Size Analyzer | Measures the Fine Sediment Fraction (FSF). | Measures particle sizes from clay to sand (0.01 - 2000 µm). |
| Statistical Software (R, Python with SciPy/NumPy) | For regression modeling, constructing probability distributions, and calculating risk/benefit metrics. | Requires libraries for advanced statistics and Monte Carlo simulation. |
A meticulously crafted problem formulation is the blueprint for a credible, actionable ecological risk assessment. Subjecting this blueprint to rigorous, structured peer review—through both internal multidisciplinary critique and independent external expert evaluation—is a non-negotiable step in the scientific process. As ERA evolves to address cumulative risks [47], ecosystem services [60], and population-level endpoints [71], the role of peer review in validating innovative conceptual models and analysis plans becomes even more critical.
The strategies outlined in this guide, from the internal review toolkit to the detailed experimental protocol for endpoint validation, provide a concrete pathway for researchers and assessors to strengthen the scientific foundation of their work. By embedding these review practices into the PF stage, the risk assessment community can ensure its work remains robust, transparent, and capable of supporting the complex environmental decisions facing society. Future efforts should focus on standardizing review criteria for emerging ERA paradigms and fostering broader stakeholder participation in the PF review process to enhance both scientific legitimacy and societal relevance.
Validating Conceptual Models and Assessment Endpoints with Empirical Evidence
In ecological risk assessment (ERA), problem formulation establishes the scientific foundation and regulatory boundaries for the entire evaluation process [4]. It is during this critical first phase that conceptual models are articulated and assessment endpoints are selected, creating a framework that links potential stressors to valued ecological entities [3]. The central thesis of this guide is that the scientific credibility and regulatory utility of an ERA are contingent upon the rigorous, empirical validation of these core components established during problem formulation. Validation transforms a hypothetical construct into a reliable tool for prediction and decision-making.
Conceptual models are written descriptions and visual representations of predicted relationships between ecological entities and the stressors to which they may be exposed [3]. Assessment endpoints are explicit expressions of the environmental value to be protected, defined by an ecological entity and its key attributes [4]. Without validation, these elements remain untested assumptions, introducing significant uncertainty into risk estimates and potentially compromising environmental management decisions. This guide provides researchers and product development professionals with a technical framework for integrating empirical validation directly into the ERA workflow, ensuring assessments are both scientifically defensible and fit for regulatory purpose.
Deconstructing the Conceptual Model for Empirical Testing
A conceptual model in ERA serves as an organizing hypothesis, diagramming the pathways by which a stressor (e.g., a chemical, biological agent, or physical change) may lead to an adverse ecological effect [2]. The U.S. Environmental Protection Agency (EPA) defines it as consisting of two core components: a set of risk hypotheses and a diagram illustrating these relationships [3]. Empirical validation tests the plausibility, completeness, and relative importance of the linkages within this model.
Table: Core Components of an ERA Conceptual Model and Validation Focus
| Model Component | Description | Key Validation Question |
|---|---|---|
| Stressor Source & Characteristics | Origin, intensity, duration, and frequency of the stressor [3]. | Are the characterized properties of the stressor accurate and complete for the exposure scenario? |
| Exposure Pathways | Routes (e.g., dermal, ingestion, inhalation) and media (air, water, soil) through which receptors encounter the stressor [3]. | Do the depicted pathways represent the dominant and most relevant routes of exposure? |
| Ecological Receptors | Species, communities, habitats, or ecosystems potentially affected [4]. | Are the selected receptors appropriately sensitive and ecologically valuable? |
| Response Linkages | Predicted cause-effect relationships between exposure and receptor attributes. | Is there empirical evidence supporting the hypothesized effect? What is the nature of the dose-response relationship? |
| Assessment Endpoint | The specific ecological value (entity + attribute) to be protected [2]. | Is the endpoint measurable and does it genuinely reflect the management goal? |
The process of problem formulation is iterative and interactive [3]. Validation activities should be planned within the analysis plan developed at the end of problem formulation, which targets risk hypotheses likely to contribute to risk and identifies data needs and uncertainties [2].
Flowchart: Empirical Validation Integrated into Problem Formulation
Defining and Qualifying Assessment Endpoints
An assessment endpoint operationalizes a broad management goal (e.g., "maintain a sustainable aquatic community") into a concrete target for scientific measurement [2]. It consists of the valued ecological entity (e.g., fathead minnow populations) and the specific attribute of that entity to be protected (e.g., reproductive success) [4]. The validation of an assessment endpoint confirms its relevance, sensitivity, and practicality.
Endpoint Relevance ensures a direct connection to the stated management goal and ecological value. For example, if the goal is to protect avian biodiversity, an endpoint focused solely on acute mortality in a single species may be less relevant than one examining chronic reproductive effects in a range of species with different ecological functions. Endpoint Sensitivity refers to the attribute's responsiveness to the stressor at environmentally relevant levels. The chosen attribute must be a meaningful indicator of harm, not a minor or transient change. Finally, Endpoint Practicality addresses whether the attribute can be measured or estimated with sufficient precision and accuracy given technical, temporal, and financial constraints [2].
Validation often requires distinguishing between the assessment endpoint (the environmental value) and the measurement endpoint (the measurable response used to infer a change in the assessment endpoint) [4]. For instance, the assessment endpoint may be "reproductive success of small mammals," while the measurement endpoints could be uterine implant counts, sperm motility, or offspring survival in laboratory studies. Empirical validation must establish a strong, causally linked relationship between the measurement endpoint and the assessment endpoint it is intended to represent.
Strategies and Protocols for Empirical Validation
Validation strategies must be tailored to the phase of the ERA and the nature of the conceptual model linkage or assessment endpoint in question. A tiered approach, beginning with targeted laboratory studies and progressing to complex field validations, is often the most resource-efficient [2].
Targeted Laboratory Toxicity Testing: For validating hypotheses about direct effects on individual organisms, standardized toxicity tests provide foundational data. Protocols follow internationally recognized guidelines (e.g., OECD, EPA, ASTM).
- Objective: To establish a quantitative dose- or concentration-response relationship for a critical effect linked to an assessment endpoint.
- Protocol Example (Fish Early Life Stage Test): Expose fertilized eggs and subsequent larval stages of a surrogate fish species (e.g., fathead minnow, zebrafish) to a graded series of contaminant concentrations in a flow-through or renewal system. Primary measurements include embryonic survival, hatch success, larval survival, and larval growth over a test duration (e.g., 28-32 days post-hatch). Endpoints like NOEC (No Observed Effect Concentration) and LC/EC50 are derived to validate thresholds in the conceptual model [3].
Model Ecosystem (Mesocosm) Studies: These semi-field studies bridge the gap between laboratory and nature, validating exposure pathways and population- or community-level effects.
- Objective: To test the accuracy of conceptual model predictions regarding indirect effects, bioaccumulation, and ecosystem interactions under controlled but realistic environmental conditions.
- Protocol Example (Aquatic Pond Mesocosm): Establish multiple outdoor ponds (e.g., 5,000-15,000 L) with natural sediment, macrophytes, and invertebrate communities. Introduce a gradient of the stressor. Monitor over weeks to months for direct effects on invertebrates and fish, as well as indirect effects via food web disruption (e.g., algal blooms from reduced grazing) and nutrient cycling. This validates hypothesized multi-pathway exposures and community-level risk hypotheses [4].
Field Monitoring and Natural Experimentation: This involves collecting data from environments affected by the stressor to validate the final conceptual model and endpoint relevance.
- Objective: To assess the real-world predictive accuracy of the risk assessment framework.
- Protocol Example (Before-After-Control-Impact Design): Identify field sites slated for a known stressor release (e.g., effluent discharge). Collect pre-release baseline data on assessment and measurement endpoints (e.g., benthic macroinvertebrate diversity, fish condition indices) at both the impact site and a similar control site. Post-release, monitor the same endpoints at regular intervals. Statistical comparison (e.g., ANOVA, time-series analysis) of trends between control and impact sites validates the model's predictions of effect magnitude and recovery trajectory [3].
Systematic Review and Meta-Analysis: For validating endpoints and relationships for established stressors, synthesis of existing evidence is a powerful tool.
- Objective: To quantitatively evaluate the strength and consistency of empirical evidence for a specific risk hypothesis across multiple studies.
- Protocol Example: A 2023 scoping review protocol for validating digital clinical endpoints provides a transferable methodology [73]. It involves a systematic search of multiple databases (PubMed, Scopus, Web of Science, etc.) with predefined terms, screening by multiple independent reviewers, and structured data extraction to map validation methods, associated endpoints, and evidence quality [73]. Applied to ERA, this can validate, for instance, the ubiquity of a particular pathway (e.g., sediment bioaccumulation for lipophilic pesticides) across ecosystems.
The Scientist's Toolkit: Essential Reagents and Materials
Table: Key Research Reagent Solutions for Validation Studies
| Tool/Reagent | Function in Validation | Example Application |
|---|---|---|
| Standardized Test Organisms | Provides a consistent, sensitive biological reagent for toxicity testing. | Ceriodaphnia dubia (water flea) for chronic reproduction tests; Lenna minor (duckweed) for plant growth inhibition tests. |
| Analytical Reference Standards | Enables precise quantification of stressor concentration in media and tissue, critical for dose-response validation. | High-purity chemical standards for calibrating GC-MS, LC-MS, or ICP-OES instruments to measure pesticide residues or metals. |
| Environmental DNA (eDNA) Extraction & Sequencing Kits | Allows for sensitive, comprehensive characterization of ecological receptor communities (biodiversity) as an assessment endpoint. | Validating changes in benthic macroinvertebrate or soil microbial community structure in mesocosm or field studies. |
| Passive Sampling Devices (e.g., SPMDs, POCIS) | Integrates and measures time-weighted average concentrations of bioavailable stressors in water, validating exposure estimates. | Deploying in situ to measure freely dissolved concentrations of hydrophobic organic contaminants for model calibration. |
| Stable Isotope Tracers (e.g., ¹⁵N, ¹³C) | Traces the flow of stressors and energy through food webs, validating exposure and bioaccumulation pathways. | Adding an isotope-labeled contaminant to a mesocosm to track its assimilation into algae, invertebrates, and fish. |
| Data Analysis & Modeling Software (e.g., R, PRZM, AQUATOX) | Provides statistical and simulation frameworks to analyze validation data and quantify model-performance metrics. | Using R for dose-response modeling and AQUATOX to compare simulated ecosystem effects to mesocosm observations. |
Interpreting Validation Data and Refining the Assessment Framework
The culmination of empirical work is the interpretation of data against the risk hypotheses and assessment endpoints. Success is not merely statistical significance but the strength of evidence in supporting or refuting the pre-formulated conceptual relationships.
Key interpretation steps include:
- Quantifying Concordance: Calculate metrics like correlation coefficients, goodness-of-fit indices (e.g., R² for dose-response models), or comparison of measured versus predicted values (e.g., for exposure concentrations).
- Evaluating Uncertainty: Distinguish between reducible uncertainty (e.g., from small sample size) and inherent variability (natural ecological fluctuation). Validation studies should characterize both [2].
- Iterative Refinement: As highlighted in the problem formulation process, validation is iterative [3]. Data indicating a missing exposure pathway (e.g., groundwater transport) or a unexpectedly sensitive receptor (e.g., a particular amphibian life stage) must feed back into a refined conceptual model and, potentially, revised assessment endpoints.
A successfully validated framework demonstrates that the conceptual model adequately represents the system, the assessment endpoints are meaningful indicators of the valued ecological entities, and the measurement endpoints provide reliable data. This forms a solid, evidence-based foundation for the subsequent phases of risk assessment: analysis and risk characterization [3].
Diagram: Logical Workflow for Interpreting Validation Evidence
Empirical validation is the essential process that grounds the theoretical constructs of problem formulation—the conceptual model and assessment endpoints—in observable, measurable reality. For researchers and drug development professionals, particularly those seeking regulatory approval for agrochemicals or other environmental stressors, integrating robust validation protocols from the outset is not merely a scientific best practice but a strategic necessity. It reduces uncertainty, focuses resources on critical risk pathways, and builds defensible assessments. A validated ERA framework delivers clear, evidence-based insights, enabling risk managers to make informed decisions that genuinely protect ecological integrity and public trust [2] [4].
Problem Formulation is the foundational and arguably most critical phase of any risk assessment, serving as the strategic blueprint that determines its relevance, efficiency, and ultimate utility for decision-makers [71]. It is the process of defining the problem, establishing clear assessment goals, and planning the analytical approach based on available information and specific management needs [12] [2]. Within the broader thesis on advancing Ecological Risk Assessment (ERA) research, a comparative analysis with Human Health Risk Assessment (HHRA) reveals fundamental philosophical and methodological divergences originating in this initial phase. While both frameworks share a common overarching goal—to inform risk management decisions—their pathways diverge sharply in Problem Formulation due to the distinct nature of the entities being protected: complex, hierarchical ecological systems versus the individual human organism [74].
Historically, HHRA has been criticized for sometimes applying a formulaic, checklist-based approach, which can overlook site-specific contexts [50]. In contrast, ERA has more explicitly institutionalized Problem Formulation as an integrative, iterative, and hypothesis-driven exercise [12] [71]. This analysis will deconstruct the Problem Formulation phase in both domains, comparing their structural frameworks, defining characteristics, and methodological outputs. The synthesis underscores that the explicit and early consideration of ecological complexity—from population dynamics to ecosystem services—is not merely a procedural difference but a necessary adaptation to the assessment's subject, offering valuable lessons for the evolution of both fields.
Structural Framework and Phase Objectives
Both ERA and HHRA follow a structured, phased process initiated by planning and scoping, which is closely integrated with Problem Formulation [12] [75]. The formal steps, however, are organized differently, reflecting their core analytical priorities.
Table 1: Comparative Structural Framework of ERA and HHRA
| Phase | Ecological Risk Assessment (ERA) | Human Health Risk Assessment (HHRA) |
|---|---|---|
| Planning | Collaborative dialogue to define management goals, scope, complexity, and roles [12] [7]. | Collaborative dialogue to define management goals, scope, complexity, and roles [75]. |
| Problem Formulation | Integrated Phase 1: Synthesizes planning into assessment endpoints, conceptual models, and an analysis plan [7] [2]. | Embedded in Steps: Primarily addressed within Step 1: Hazard Identification [75] [50]. |
| Analysis | Phase 2: Parallel analyses of Exposure and Ecological Effects (stressor-response) [12] [7]. | Steps 2 & 3: Sequential Dose-Response Assessment and Exposure Assessment [75]. |
| Risk Characterization | Phase 3: Integrates exposure and effects analyses to estimate and describe risk [12] [7]. | Step 4: Integrates hazard, dose-response, and exposure analyses to characterize risk [75]. |
In ERA, Problem Formulation is a distinct, dedicated phase where the planning agreements are translated into actionable scientific terms [2]. Its primary objectives are to refine assessment objectives, identify the ecological entities at risk and their protectable attributes (assessment endpoints), and develop a conceptual model and analysis plan [12].
In HHRA, the elements of Problem Formulation are traditionally embedded within the hazard identification step, focusing on determining whether a stressor has the potential to cause harm to humans and under what circumstances [75]. Recent critiques and guidance, however, advocate for adopting a more explicit and upfront Problem Formulation step in HHRA to better incorporate site-specific exposure pathways and scenarios, moving beyond default assumptions [50].
Core Components of Problem Formulation: A Detailed Comparison
Defining Assessment Endpoints
The selection of assessment endpoints is the most telling distinction between the two fields, directly stemming from their protection goals.
Table 2: Characteristics of Assessment Endpoints
| Characteristic | Ecological Risk Assessment (ERA) | Human Health Risk Assessment (HHRA) |
|---|---|---|
| Primary Entity | Ecological systems at multiple levels of organization: species, population, community, ecosystem, habitat [12] [71]. | The individual human being, with consideration for susceptible subgroups (e.g., children, elderly) [75]. |
| Valued Attribute | Ecologically Relevant: Survival, reproduction, growth, community structure, ecosystem function (e.g., nutrient cycling, productivity) [12]. | Health-Based: Morbidity, mortality, cancer incidence, organ function, developmental effects [75]. |
| Selection Criteria | Ecological relevance, susceptibility to stressor, and relevance to management goal [12]. Public values (charismatic species, ecosystem services) are explicit factors [12] [71]. | Public health protection, with special emphasis on susceptibility due to life stage (e.g., children), genetics, or pre-existing conditions [75]. |
| Typical Endpoint Examples | - Sustainable population of brook trout. - Reproductive success of the endangered piping plover. - Functional integrity of a wetland ecosystem [12] [7]. | - Increased incidence of lung cancer. - Neurodevelopmental delay in children. - Liver toxicity in adults [75]. |
ERA endpoints are explicitly chosen to be ecologically relevant and tied to ecosystem services. The process acknowledges that protecting a system's structure and function often requires endpoints at the population or community level, even if measured via individual-level effects [2] [71]. HHRA endpoints are intrinsically health-focused on the individual, though they must account for variability in susceptibility, most notably during critical windows of development [75].
Developing the Conceptual Model
The conceptual model is a visual and narrative hypothesis about how stress causes harm.
In ERA, the model is a central, formal output of Problem Formulation. It is an ecosystem-scale flow diagram linking stressor sources to receptors through exposure pathways, culminating in potential effects on the assessment endpoint [12] [2]. It forces consideration of indirect effects (e.g., loss of prey leading to predator decline) and complex interactions within the system [71].
In HHRA, conceptual models of exposure pathways are used but have historically been less emphasized in formal guidelines. The focus is typically on direct pathways from a source to the human receptor (e.g., ingestion of contaminated soil, inhalation of air pollutants) [50]. There is a growing push to make these models more explicit and comprehensive, especially for complex sites [50].
Diagram 1: ERA Conceptual Model for a Contaminated Watersite
Analysis Plan and Data Requirements
The analysis plan specifies the methods for evaluating exposure and effects.
ERA Analysis is bifurcated into parallel lines of evidence: exposure assessment and ecological effects assessment [12]. The effects assessment evaluates stressor-response relationships, which may come from laboratory toxicity tests on surrogate species or field studies [12] [2]. For pesticides, standard laboratory tests on birds, mammals, fish, aquatic invertebrates, and plants form the core data [2]. The analysis must then consider how individual-level effects translate to population or community-level consequences, often requiring modeling or expert judgment [71].
HHRA Analysis follows a more linear sequence: hazard identification leads to a dose-response assessment, which quantifies the relationship between the amount of exposure (dose) and the probability of a health effect [75]. This relies heavily on epidemiological studies and controlled animal toxicology experiments. The subsequent exposure assessment estimates the intensity, frequency, and duration of human contact with the stressor [75]. A critical data need is for exposure factors specific to sensitive life stages, particularly children, who have different behaviors and physiological susceptibilities [75].
Methodological Protocols and Experimental Approaches
The following protocols exemplify standard methodologies referenced during the Problem Formulation and Analysis phases for generating key toxicity data.
Protocol 1: Avian Acute Oral Toxicity Test (EPA OCSPP 850.2100)
- Objective: To determine the median lethal dose (LD₅₀) of a chemical (e.g., pesticide) to birds for prospective ERA [2].
- Test Organisms: Northern bobwhite quail (Colinus virginianus) and mallard duck (Anas platyrhynchos) are standard surrogate species [2].
- Procedure: Birds are administered a single dose of the test substance via oral gavage. Dosages are varied across treatment groups according to a predefined progression. Birds are observed for mortality and signs of toxicity (e.g., ataxia, lethargy, convulsions) at specified intervals for 14 days.
- Endpoint: The LD₅₀ (dose estimated to be lethal to 50% of the test population) is calculated using statistical methods like probit analysis. This value is used in risk quotient calculations during the Risk Characterization phase.
Protocol 2: Aquatic Invertebrate Life-Cycle Test (e.g., Daphnia magna Reproduction Test)
- Objective: To assess chronic effects of a chemical on survival, growth, and reproduction of aquatic invertebrates [12] [2].
- Test Organisms: A cohort of young female Daphnia magna (<24 hours old) from a healthy, synchronized culture.
- Procedure: Daphnids are exposed to a range of concentrations of the test chemical in a renewal or flow-through system for 21 days. They are fed a standard diet daily. The number of living offspring produced by each female is recorded and removed daily. Maternal survival is monitored.
- Endpoint: The No Observed Adverse Effect Concentration (NOAEC) and/or the Effective Concentration affecting reproduction by 20% (EC₂₀) are derived. These are used to establish chronic toxicity thresholds for aquatic life.
Protocol 3: Mammalian Toxicokinetic Study for HHRA Dose-Response
- Objective: To understand the absorption, distribution, metabolism, and excretion (ADME) of a chemical in a mammalian model, informing species extrapolation and dose scaling for HHRA [75].
- Test System: Laboratory rats or mice, often with radiolabeled (¹⁴C) test chemical to track all metabolites.
- Procedure: Animals receive a single administered dose (oral, dermal, or inhalation). Blood, tissues, urine, and feces are collected at multiple time points. The concentration of the parent compound and its metabolites is quantified in these samples using analytical techniques like liquid scintillation counting or LC-MS/MS.
- Endpoint: Development of a quantitative ADME model, calculation of key parameters (bioavailability, half-life, area under the curve), and identification of the toxicologically active metabolite(s). This data is critical for determining the internal target organ dose for use in human health risk modeling.
The Scientist's Toolkit: Essential Research Reagent Solutions
Table 3: Key Research Reagents and Materials for Risk Assessment Studies
| Item | Function in Risk Assessment | Typical Application |
|---|---|---|
| Standardized Test Organisms | Provide consistent, reproducible biological response systems for toxicity testing. Surrogate species represent broader taxonomic groups [2]. | - Fathead minnow (Pimephales promelas): Standard freshwater fish for acute and chronic tests. - Ceriodaphnia dubia: Cladoceran for short-term chronic aquatic tests. - Laboratory rat (Rattus norvegicus): Primary mammalian model for human health toxicology [75] [2]. |
| Reference Toxicants | Used to verify the health and sensitivity of test organisms. A standard chemical with known toxicity (e.g., potassium dichromate for fish, sodium chloride for Daphnia). | Quality assurance/quality control (QA/QC) in all laboratory bioassays to ensure results are reliable and not due to anomalous organism health. |
| Formulated Test Substance | The chemical or mixture of interest prepared in a vehicle suitable for delivery to the test system (e.g., via feed, water, gavage, topical application). | For pesticide ERA, the formulated product (as sold) may be tested in addition to the pure active ingredient to account for effects of inert carriers [2]. |
| Artificial Soil/Water | Standardized, reproducible media with defined physicochemical properties for testing. Removes variability from natural substrates. | - Reconstituted hard water: For aquatic toxicity tests per ASTM/EPA guidelines. - Artificial soil: For earthworm or plant toxicity tests, with specified peat, clay, and sand ratios. |
| In Vitro Bioassay Kits | New Approach Methodologies (NAMs) for high-throughput screening of hazard potential, especially for complex mixtures [76]. | - Luminescent cell-line assays (e.g., CALUX): Detect receptor-mediated activity (estrogenic, dioxin-like). - Micro-omics kits: For transcriptomic or metabolomic profiling of mixture effects. |
| Chemical Standards & Mass Spectrometry Libraries | Essential for identifying and quantifying chemicals in environmental samples or biological matrices during exposure assessment. | Non-targeted analysis (NTA) using high-resolution mass spectrometry relies on extensive spectral libraries to characterize complex mixtures [76]. |
Advanced Considerations and Future Directions
Problem Formulation must evolve to address modern scientific and regulatory challenges. Key areas include:
- Assessing Complex Mixtures: Both fields struggle with evaluating combined effects of multiple chemicals. Problem Formulation must decide between a whole-mixture approach (treating it as a single entity) or a component-based approach [76]. Whole-mixture assessment is preferred but requires determining "sufficient similarity" between the mixture of concern and a tested mixture, using chemical profiling and bioactivity data [76].
- Incorporating Advanced Science: ERA is challenged to move beyond organism-level endpoints to protect populations and ecosystems. Problem Formulation should plan for the use of population models, spatially explicit exposure models, and adverse outcome pathways (AOPs) that can link molecular events to ecological impacts [71].
- Iterative and Fit-for-Purpose Frameworks: A rigid, one-size-fits-all approach is inefficient. Problem Formulation should adopt iterative, tiered strategies that start with conservative screening and proceed to more complex assessments only as needed [2] [77]. This "fit-for-purpose" philosophy ensures resources are allocated efficiently based on the specific management decision [77].
Diagram 2: Iterative Risk Assessment Workflow with Problem Formulation
The comparative analysis of Problem Formulation in Ecological and Human Health Risk Assessment reveals a fundamental divergence tailored to the complexity of the protected entity. ERA has developed a robust, explicit phase dedicated to defining ecosystem-scale assessment endpoints and conceptual models that account for indirect effects and ecological relevance. HHRA, while methodologically rigorous in its dose-response framework, has historically been more linear and individual-focused, though it is increasingly recognizing the value of a more explicit Problem Formulation step to handle site-specific complexity [50].
The future of effective risk assessment lies in strengthening this foundational phase. This involves embracing iterative, fit-for-purpose approaches that can incorporate advanced scientific tools—from population ecology models and non-targeted chemical analysis to high-throughput bioassays—directly into the assessment plan conceived at the outset. For researchers and drug development professionals, this underscores that the upfront investment in meticulously defining the problem, the relevant endpoints, and the conceptual pathways to harm is not a bureaucratic step but the critical determinant of a risk assessment's scientific credibility and practical utility.
Within the structured discipline of ecological risk assessment (ERA), problem formulation (PF) is the critical first step that determines the entire trajectory and relevance of the scientific investigation [4]. It is the process of distilling broad policy goals, scientific questions, and societal concerns into an explicitly stated problem and a defined approach for analysis [4]. A rigorously executed PF ensures that the assessment addresses the most relevant exposure scenarios and potential consequences, thereby producing outcomes that are actionable for environmental decision-making [4]. Conversely, an inadequate PF can compromise the entire ERA, leading to misdirected resources, increased uncertainty, and ineffective or delayed environmental protection measures [4].
This guide addresses a persistent and critical challenge in environmental science: the misalignment between the standardized procedures of regulatory ERA and the goal-oriented frameworks of nature conservation, exemplified by the International Union for Conservation of Nature (IUCN) Red List of Ecosystems [52]. While ERA traditionally focuses on characterizing the risk from specific stressors (e.g., a chemical, a genetically modified organism) to ecological entities, nature conservation assessments prioritize the protection of valued species and ecosystems based on their risk of extinction or collapse [78] [52]. This divergence often results in conservation goals being poorly represented in ERA problem formulation and, consequently, in risk management decisions.
Framed within a broader thesis on advancing PF methodologies, this technical guide provides a structured approach for integrating IUCN Red List of Ecosystems criteria and principles into the foundational PF phase of ERA. The objective is to bridge the gap between these two complementary fields, enabling risk assessors to formulate problems that are not only toxicologically sound but also directly relevant to biodiversity conservation priorities.
Conceptual Foundations: ERA vs. Nature Conservation Assessment
To bridge the gap between ERA and nature conservation, it is essential to first understand their distinct philosophical underpinnings, objectives, and operational protocols. The following table summarizes the key divergences between the two approaches.
Table 1: Comparative Analysis of ERA and Nature Conservation Assessment (IUCN) Approaches [4] [78] [52]
| Aspect | Ecological Risk Assessment (ERA) | Nature Conservation Assessment (IUCN Red List) |
|---|---|---|
| Primary Goal | To identify, estimate, and characterize the risk of adverse ecological effects from a specific stressor or activity [4]. | To assess the relative risk of collapse for ecosystems (or extinction for species) to inform conservation priorities and actions [78]. |
| Unit of Assessment | Often a stressor (e.g., a pesticide, a GM plant trait). Effects are evaluated on selected assessment endpoints (e.g., a species, a community function) [4]. | The ecosystem type itself (or a species), defined by its characteristic native biota, environment, and processes [78]. |
| Core Question | “What is the likelihood and magnitude of adverse effects from Exposure X?” | “What is the relative risk of collapse for Ecosystem Y?” |
| Temporal Focus | Often prospective (predicting future risk) or retrospective (assessing existing impact). | Evaluates current status, often incorporating historical decline to project future risk [78]. |
| Valued Component | Assessment Endpoints: Explicit expressions of environmental values to be protected, defined by an entity (e.g., rainbow trout) and its attribute (e.g., reproductive success) [4]. | Ecosystem Identity: Defined by its characteristic native biota, abiotic environment, and key processes/interactions. Collapse is the loss of this defining identity [78]. |
| Threat Characterization | Detailed analysis of a specific stressor’s mode of action, dose-response, and exposure pathways. | Broad categorization of threatening processes (e.g., “agricultural expansion,” “pollution”). Often does not specify exact exposure or mechanism [52]. |
| Typical Output | A risk estimate (qualitative or quantitative) supporting a risk management decision (e.g., approve, restrict, remediate). | A categorical risk classification (e.g., Vulnerable, Endangered) supporting conservation priority-setting and policy [78]. |
The IUCN Red List of Ecosystems (RLE) provides a standardized framework for assessing the risk of ecosystem collapse. Its criteria are based on symptoms of decline that can be quantified. Aligning ERA with these criteria requires understanding their basis.
Table 2: IUCN Red List of Ecosystems Criteria for Risk of Collapse [78]
| Criterion | Measurable Symptom | Key Metrics (Proxy Variables) |
|---|---|---|
| A. Declining Distribution | Ongoing or future reduction in geographic distribution. | Rate of decline in spatial extent over a specified time period. |
| B. Restricted Distribution | Limited geographic distribution coupled with ongoing or future threats or decline. | Extent of Occurrence (EOO), Area of Occupancy (AOO), plus fragmentation or threats. |
| C. Environmental Degradation | Abiotic environment degradation leading to reduced quality for biota. | Measurable changes in physical/chemical conditions (e.g., water quality, soil pH, sedimentation). |
| D. Disrupted Biotic Processes | Disruption of key species interactions or ecosystem processes. | Measures of recruitment, pollination, predation rates, or functional group composition. |
| E. Quantitative Risk Analysis | Integrated model projecting risk of collapse within a given timeframe. | Stochastic or deterministic models of ecosystem dynamics under threat scenarios. |
Methodological Integration: A Stepwise Protocol for Alignment
Bridging the ERA and conservation paradigms requires a modified PF workflow that explicitly incorporates conservation goals and data. The following protocol outlines this integrated approach.
Step 1: Define the Conservation Context and Assessment Endpoints Initiate PF by consulting relevant IUCN Red Lists (species and ecosystems) and national/regional conservation plans for the assessment area [78] [52]. Identify listed ecosystems and species, and analyze the documented threats. Instead of generic assessment endpoints, formulate them as:
- Entity: A IUCN-listed ecosystem type (e.g., “Lowland Fynbos”) or a characteristic species of a listed ecosystem.
- Attribute: An attribute linked to an RLE criterion (e.g., “spatial extent” for Criterion A, “water clarity” as an indicator for Criterion C).
Step 2: Conduct a Stressor-Conservation Threat Crosswalk Analyze how the specific stressor of concern (e.g., a chemical, land-use change) maps onto the broad threat categories affecting the identified conservation targets [52]. For example, if the stressor is a herbicide and a nearby protected wetland ecosystem is listed as Vulnerable due to “agricultural pollution,” establish a plausible pathway linking herbicide runoff to a specific metric of ecosystem degradation (Criterion C) or biotic disruption (Criterion D).
Step 3: Develop Risk Hypotheses Focused on Conservation Metrics Translate the exposure scenario into a testable risk hypothesis structured around an RLE metric. A generic hypothesis template is: “Exposure to [Stressor] at [Planned Level] will lead to a change in [RLE Metric, e.g., rate of spatial decline, soil organic matter] for [Ecosystem Type] over [Timeframe], sufficient to alter its risk of collapse classification.”
Step 4: Design the Analysis Plan with Conservation-Sensitive Models Select measurement endpoints and models that can quantify effects on the chosen RLE metrics. This may involve:
- Using spatial modeling to project changes in Area of Occupancy (AOO) (Criterion B).
- Employing mesocosm or field studies to measure impacts on biotic interactions like decomposition or pollination (Criterion D).
- Applying Species Sensitivity Distributions (SSDs) weighted towards or including IUCN Red Listed species relevant to the ecosystem, rather than only standard test species [52].
Application Workflow: From Integration to Decision
The following diagram illustrates the integrated problem formulation workflow, showing how conservation goals inform each stage of the traditional ERA process.
The IUCN Red List of Ecosystems assessment follows its own rigorous process, which ERA can directly inform. The logic of this process is shown below.
Conducting an ERA aligned with conservation goals requires specific tools and resources. The following table details key solutions for this interdisciplinary work.
Table 3: Research Toolkit for Conservation-Aligned Ecological Risk Assessment
| Tool/Resource Category | Specific Item or Protocol | Function in Integrated Assessment |
|---|---|---|
| Data Sources & Platforms | IUCN Red List of Ecosystems & Species databases; National habitat/vegetation maps; Protected area spatial data (e.g., WDPA). | Provides the foundational conservation context, identifies assessment units (ecosystem types), and lists characteristic biota to protect [78]. |
| Spatial Analysis Tools | Geographic Information System (GIS) software (e.g., QGIS, ArcGIS); Remote sensing imagery (satellite, aerial). | Essential for quantifying IUCN RLE Criteria A & B (distribution decline, extent). Used to map exposure, ecosystem extent, and habitat suitability models. |
| Field & Laboratory Assays | Standard ecotoxicity tests (e.g., OECD, EPA) using relevant species; Functional response assays (e.g., litter decomposition, seed germination); Environmental sample analysis (chemical, eDNA). | Generates hazard data. Strategic selection of test species informed by IUCN lists improves relevance [52]. Functional assays inform Criteria C & D. |
| Exposure & Uptake Models | Bioaccumulation models (e.g., OMEGA); Environmental fate models (e.g., fugacity-based); Hydrological dispersal models. | Predicts the concentration, fate, and bioavailability of stressors in environmental compartments inhabited by conservation targets. |
| Ecological Effect Models | Species Sensitivity Distributions (SSDs); Population viability analysis (PVA); Individual-Based Models (IBMs); Ecosystem process models. | SSDs estimate hazardous concentrations. PVA/IBMs can project impacts on population trends of listed species. Process models inform Criteria D & E. |
| Risk Integration Software | Bayesian network software; Multi-criteria decision analysis (MCDA) tools; Probabilistic risk assessment platforms. | Supports the synthesis of complex, multi-criteria data from both ERA and RLE assessments for transparent risk characterization and decision-making. |
Evaluating the Success of Problem Formulation in Subsequent Risk Characterization and Management
Within the structured paradigm of ecological risk assessment (ERA), problem formulation is not merely a preliminary step but the critical foundation that determines the efficacy, efficiency, and regulatory utility of the entire process. It serves as the essential interface between risk managers and risk assessors, translating broad environmental management goals into a scientifically robust and actionable assessment plan [2] [25]. The core thesis of this guide is that the success of subsequent risk characterization and management decisions is intrinsically dependent upon the clarity, comprehensiveness, and logical coherence established during problem formulation. A well-executed problem formulation phase ensures the assessment is focused on relevant endpoints, utilizes appropriate methodologies, and directly addresses the needs of decision-makers, thereby yielding a risk characterization that is transparent, reasonable, and actionable for managing environmental stressors such as industrial chemicals and pesticides [2] [7].
This technical guide details the components of problem formulation, establishes criteria for evaluating its success, and provides methodologies for linking this foundational phase to definitive risk characterization and management outcomes.
Core Components of Problem Formulation
Problem formulation is an integrative and iterative process that synthesizes available information to define the assessment's pathway. Its success hinges on the completion and agreement of several key components between risk assessors and risk managers [2].
Planning Dialogue and Agreement
The process initiates with a planning dialogue to establish [2]:
- Management Goals: The desired environmental state to be protected (e.g., "maintaining a sustainable aquatic community") [2].
- Regulatory Context: The nature of the regulatory action (e.g., new pesticide registration) [2].
- Scope & Complexity: Agreements on spatial/temporal scales, data quality, and tolerated uncertainty, often structured through a tiered assessment strategy [2].
Development of Assessment Endpoints
Assessment endpoints operationalize management goals by specifying the ecological entity (e.g., a fish species, an aquatic community) and its valued attribute (e.g., reproduction, survival) that is to be protected. They provide the direction and boundaries for the entire assessment [2].
Creation of a Conceptual Model
A conceptual model is a visual and narrative tool consisting of [2]:
- Risk Hypotheses: Articulated assumptions about predicted relationships between a stressor, exposure, and effect on the assessment endpoint.
- Diagrammatic Illustration: A flow diagram linking stressors, exposure pathways, ecological receptors, and effects. This model identifies data gaps, key relationships, and sources of uncertainty.
Analysis Plan
The final component is a plan detailing how data will be analyzed to test the risk hypotheses. It specifies the measures of exposure and effect (e.g., LC50, predicted environmental concentration), the assessment design, and how results will inform risk characterization [2].
Table 1: Key Components of Problem Formulation and Their Outputs
| Component | Primary Objective | Critical Outputs | Key Stakeholders |
|---|---|---|---|
| Planning Dialogue | Align assessment with management needs. | Defined management goals, regulatory context, and scope. | Risk Managers, Risk Assessors |
| Assessment Endpoints | Translate goals into measurable ecological values. | Clear specification of the entity and attribute to protect. | Risk Assessors |
| Conceptual Model | Visualize stressor-exposure-effect pathways. | Risk hypotheses and diagram of ecosystem relationships. | Risk Assessors, Subject Experts |
| Analysis Plan | Define the technical approach for the analysis phase. | Detailed protocol for exposure/effects analysis and risk estimation. | Risk Assessors |
Quantitative and Qualitative Metrics for Evaluating Success
The success of problem formulation can be evaluated prospectively (at its completion) and retrospectively (based on the assessment's outcome) using specific metrics.
Prospective Evaluation Criteria
These criteria assess the intrinsic quality of the problem formulation components before the analysis phase begins [2] [25].
- Clarity & Specificity: Are assessment endpoints unambiguous and measurable?
- Logical Consistency: Is there a clear, defendable line from management goals to endpoints to the conceptual model?
- Testability of Hypotheses: Can the risk hypotheses be evaluated with available or obtainable data?
- Stakeholder Alignment: Has consensus been achieved among risk assessors, managers, and interested parties on the plan's scope and goals? [25]
Retrospective Evaluation Metrics
These metrics evaluate success based on the performance of the subsequent risk assessment.
- Efficiency of Assessment: Was the assessment completed without major mid-course corrections due to poorly defined endpoints or pathways? A successful formulation minimizes redundant analysis.
- Actionability of Risk Characterization: Did the risk characterization directly inform and enable risk management decisions? [7]
- Resolution of Uncertainty: Was the assessment able to address the key uncertainties identified in the conceptual model?
Table 2: Tiered Testing Approach as a Function of Problem Formulation Scope [2]
| Tier | Assessment Scope | Data Requirements | Management Decision Supported | Uncertainty Tolerance |
|---|---|---|---|---|
| Tier 1 (Screening) | Broad, conservative evaluation of many stressors/uses. | Standard toxicity endpoints, screening-level exposure models. | Prioritization for further assessment; identification of low-risk scenarios. | High |
| Tier 2 (Refined) | Focused evaluation of specific high-priority concerns. | Chemical-specific toxicity data, refined exposure modeling (e.g., fugacity). | Risk mitigation via label restrictions or use limitations. | Moderate |
| Tier 3 (Comprehensive) | Complex, site-specific or ecosystem-level assessment. | Field monitoring data, population or ecosystem modeling. | Complex regulatory decisions (e.g., remediation levels, restoration goals). | Low |
Methodological Linkage to Risk Characterization
Risk characterization integrates the exposure and effects analyses to produce qualitative and quantitative estimates of risk, along with a description of associated uncertainties [7] [79]. The quality of this integration is predetermined by problem formulation.
From Conceptual Model to Risk Estimation
The pathways diagrammed in the conceptual model dictate the necessary inputs for risk estimation. For example, a model identifying dietary exposure as a key pathway for birds directly informs the need to estimate dietary concentration (exposure) and relate it to a relevant dietary toxicity endpoint (effect) [80].
Applying the TCCR Principles
A high-quality risk characterization adheres to the principles of Transparency, Clarity, Consistency, and Reasonableness (TCCR) [79]. Problem formulation establishes the framework to achieve these:
- Transparency & Clarity: A well-documented conceptual model and analysis plan make the assessment's logic and rationale explicit.
- Consistency: Using assessment endpoints and methods aligned with agency guidelines ensures consistency across assessments [25].
- Reasonableness: The iterative dialogue between assessors and managers during problem formulation ensures the final assessment is balanced and informative for decision-making [25].
Diagram 1: ERA Workflow with Problem Formulation as Foundation (Max width: 760px).
Experimental Protocols: A Case Study in Avian Risk Assessment
The following protocol, based on a published case study, exemplifies how a problem formulation focused on testing necessity can streamline an assessment [80].
Protocol: Weight-of-Evidence Assessment to Avoid Unnecessary Avian Toxicity Testing
1. Objective: To evaluate the need for new in vivo avian toxicity tests for industrial chemicals by comparing conservative exposure estimates with a minimum hazard threshold.
2. Problem Formulation Foundations:
- Management Goal: Prioritize animal testing resources for chemicals of highest concern (Reduce, Refine, Replace - 3Rs).
- Assessment Endpoint: Survival of terrestrial bird populations from acute dietary exposure.
- Risk Hypothesis: Estimated environmental exposure concentrations are significantly below a conservative toxicity threshold, indicating negligible risk and no need for higher-tier testing.
- Conceptual Model: Chemical release -> environmental fate & transport -> dietary uptake by birds -> potential acute mortality.
3. Materials & Data Sources:
- Chemicals: 1,2-dichloropropane, 1,1,2-trichloroethane, triphenyl phosphate.
- Exposure Modeling: Fugacity/multimedia fate models (e.g., EQC, RAIDAR) using physicochemical properties to predict environmental distribution and avian dietary concentration [80].
- Hazard Characterization: Existing in vivo toxicity data, Interspecies Correlation Estimation (ICE) models, and analysis of hundreds of historic avian dietary LC50 values to establish a Minimum Hazard Threshold (e.g., 10 ppm in diet for most chemicals) [80].
- Analysis Tool: Weight-of-evidence matrix.
4. Procedure: a. Exposure Estimation: Model the environmental fate of each chemical under current use conditions. Derive a predicted maximum dietary concentration for birds (e.g., in mg/kg food). b. Hazard Threshold Application: Use the established minimum hazard threshold (10 ppm, or ~10 mg/kg diet) as a conservative benchmark for toxicity concern [80]. c. Risk Comparison: Calculate the ratio between the Hazard Threshold and the Predicted Exposure Concentration. A large margin (e.g., >4 orders of magnitude) indicates low risk. d. Uncertainty Analysis: Qualitatively evaluate uncertainties in modeling parameters and toxicity extrapolation. e. Weight-of-Evidence Integration: Synthesize modeled exposure, existing toxicity data, ICE predictions, and uncertainty analysis to support a conclusion regarding testing necessity.
5. Success Metric: The assessment successfully supported a definitive risk management decision (waiver of new testing) based on existing data and modeling, validated by the clear, testable hypothesis established in problem formulation [80].
Diagram 2: Avian Testing Necessity Assessment Workflow (Max width: 760px).
The Scientist's Toolkit: Essential Reagents & Solutions
Table 3: Key Research Reagent Solutions for Ecological Risk Assessment
| Tool Category | Specific Solution/Platform | Primary Function in ERA | Relevance to Problem Formulation |
|---|---|---|---|
| Exposure Modeling | Fugacity/Multimedia Fate Models (EQC, RAIDAR) | Predict environmental distribution and concentration of stressors based on physicochemical properties. [80] | Informs conceptual model exposure pathways; provides input for analysis plan. |
| Toxicity Assessment | Interspecies Correlation Estimation (ICE) Models | Predict acute toxicity to untested species using data from tested surrogate species. [80] | Addresses data gaps identified in problem formulation; refines hazard characterization. |
| Quantitative Analysis | Monte Carlo Simulation Software (@Risk, Crystal Ball) | Propagates variability and uncertainty in exposure and effects parameters to quantify probabilistic risk. [81] | Executes the probabilistic analysis specified in the analysis plan. |
| Data Integration & Visualization | Weight-of-Evidence Frameworks & Matrix Tools | Systematically organize and evaluate multiple lines of evidence from different data sources. [80] | Supports transparent risk characterization and decision-making as envisioned in the planning dialogue. |
| Ecological Modeling | Population Viability Analysis (PVA) Software | Project long-term impacts of stressor exposure on population growth and extinction risk. | Used in higher-tier assessments to evaluate risks to population-level assessment endpoints. |
The efficacy of ecological risk assessment is irrevocably determined at its outset. A meticulously conducted problem formulation—characterized by clear management goals, specific assessment endpoints, a logically structured conceptual model, and a detailed analysis plan—provides the blueprint for a successful assessment. It ensures that the subsequent, resource-intensive phases of analysis and risk characterization are focused, efficient, and directly relevant to environmental decision-making. By applying prospective and retrospective evaluation metrics, researchers and assessors can continuously improve this foundational process. Ultimately, investing in rigorous problem formulation is the most effective strategy for achieving risk characterizations that are transparent, reasonable, and capable of supporting sound ecological risk management.
Conclusion
Problem formulation is not merely a preliminary step but the strategic foundation that dictates the relevance, efficiency, and success of an entire ecological risk assessment. A rigorously executed process ensures that the assessment is focused on ecologically meaningful endpoints, guided by testable hypotheses, and designed to inform specific management decisions. As environmental challenges grow more complex—involving multiple chemical, physical, and biological stressors—the principles of problem formulation must evolve to support cumulative risk assessments and integrate with broader biodiversity conservation frameworks[citation:4][citation:5]. For biomedical and clinical researchers, especially in drug development where environmental fate and toxicity are critical, mastering this phase is essential for proactive environmental stewardship and regulatory compliance. Future directions involve greater integration of systems thinking, early engagement with transdisciplinary teams, and leveraging emerging data streams to reduce uncertainty, ultimately strengthening the science-policy interface for ecosystem protection.
References
- 1. Ecological Risk Assessments | AK Dept. of Environmental ... [https://dec.alaska.gov/spar/csp/faq/eco-risk/]
- 2. Technical Overview of Ecological Risk Assessment [https://www.epa.gov/pesticide-science-and-assessing-pesticide-risks/technical-overview-ecological-risk-assessment]
- 3. Phases of ERA - Planning and Problem Formulation [https://www.epa.gov/ecobox/phases-era-planning-and-problem-formulation]
- 4. Problem formulation in the environmental risk assessment ... [https://pmc.ncbi.nlm.nih.gov/articles/PMC2865628/]
- 5. EPA Proposes Changes to TSCA Risk Evaluation ... [https://www.jdsupra.com/legalnews/epa-proposes-changes-to-tsca-risk-8154014/]
- 6. Ecological Risk Assessments (ERAs) [https://www.enviroscienceinc.com/services/emergency-response/ecological-risk-assessment/]
- 7. Ecological Risk Assessment | US EPA [https://www.epa.gov/risk/ecological-risk-assessment]
- 8. The link between risk assessment and management [https://paloaltou.edu/resources/translating-research-into-practice-blog/the-link-between-risk-assessment-and-management-not-as-straightforward-as-it-seems]
- 9. A robust method for bridge safety risk assessment using ... [https://www.nature.com/articles/s41598-025-15235-x]
- 10. The Importance of a Risk Management Plan in Business [https://www.6sigma.us/project-management/risk-management-plan/]
- 11. What Is A Risk Management Plan? [Steps & Examples] [https://www.logicmanager.com/resources/erm/what-is-a-risk-management-plan/]
- 12. Conducting an Ecological Risk Assessment [https://www.epa.gov/risk/conducting-ecological-risk-assessment]
- 13. What Does An Ecological Risk Assessor Do? [https://jobs.community.kaplan.com/career/ecological-risk-assessor]
- 14. Ecological Risk Assessment - an overview [https://www.sciencedirect.com/topics/earth-and-planetary-sciences/ecological-risk-assessment]
- 15. EPA Proposes Major Changes to Chemical Risk ... [https://www.klgates.com/EPA-Proposes-Major-Changes-to-Chemical-Risk-Evaluation-Process-under-TSCA-10-9-2025]
- 16. ISO 37302 有效性评价与ISO 37303 能力管理要点简析 [https://www.zhonglun.com/research/articles/54820.html]
- 17. ISO 37302《合规管理体系有效性评价指南》 来了 [http://www.east-concord.com/zygd/Article/20258/ArticleContent_4167.html]
- 18. 量化與質化研究的比較(Quantitative定Qualitative Data好?) [https://www.saveyourgradeshk.co.uk/post/%E9%81%B8%E6%93%87%E6%AD%A3%E7%A2%BA%E7%9A%84%E7%A0%94%E7%A9%B6%E6%96%B9%E6%B3%95%EF%BC%9A%E9%87%8F%E5%8C%96%E8%88%87%E8%B3%AA%E5%8C%96%E7%A0%94%E7%A9%B6%E7%9A%84%E6%AF%94%E8%BC%83-quantitative%E5%AE%9Aqualitative-data%E5%A5%BD%EF%BC%9F]
- 19. OKR(目标与关键成果法)在项目管理中如何应用? [https://www.xuanim.com/column-view-275-0]
- 20. Color.js 中的色彩对比度计算原理与应用指南 [https://blog.csdn.net/gitblog_00799/article/details/148913242]
- 21. 如何制定色彩规范?7个步骤带你走完实战流程! - SEO优化 [https://www.youhuaxing.cn/seodongtai/19214.html]
- 22. placeholder - CSS:层叠样式表 - MDN Web Docs [https://developer.mozilla.org/zh-CN/docs/Web/CSS/Reference/Selectors/::placeholder]
- 23. Unlocking the future of environmental safety: a framework ... [https://www.sciencedirect.com/science/article/pii/S3050620425000235]
- 24. Continuous improvement towards environmental protection for ... [https://pmc.ncbi.nlm.nih.gov/articles/PMC12297009/]
- 25. Guidelines for Ecological Risk Assessment [https://www.epa.gov/risk/guidelines-ecological-risk-assessment]
- 26. Ecological Risk Assessment in Nexapa River by ... [https://link.springer.com/article/10.1007/s11270-025-08064-1]
- 27. critical evaluation of safety (uncertainty) factors for ecological ... [https://academic.oup.com/etc/article/17/1/99/7829487]
- 28. HESI Global Insights - September 2025 [https://hesiglobal.org/hesi-insights-september-2025/]
- 29. Evaluation Guidelines for Ecological Toxicity Data in the ... [https://www.epa.gov/pesticide-science-and-assessing-pesticide-risks/evaluation-guidelines-ecological-toxicity-data-open]
- 30. Integrating ecosystem stress into the assessment of ... [https://www.sciencedirect.com/science/article/pii/S1470160X24011191]
- 31. Dynamics of the shelf ecosystem ecological risk: Model ... [https://www.sciencedirect.com/science/article/abs/pii/S0272771424004335]
- 32. Integrated presentation of ecological risk from multiple ... [https://www.nature.com/articles/srep36004]
- 33. A quantitative approach for integrating multiple lines of ... [https://pmc.ncbi.nlm.nih.gov/articles/PMC4304847/]
- 34. Ecosystem Services Ecological Risk Assessment ... [https://www.epa.gov/risk/ecosystem-services-ecological-risk-assessment-endpoints-guidelines]
- 35. Review Graph theory in ecological network analysis [https://www.sciencedirect.com/science/article/abs/pii/S0959652624029536]
- 36. Guidance for the Development of Conceptual Models ... [https://www.epa.gov/pesticide-science-and-assessing-pesticide-risks/guidance-development-conceptual-models-problem]
- 37. Text has enhanced contrast | ACT Rule | WAI [https://www.w3.org/WAI/standards-guidelines/act/rules/09o5cg/]
- 38. Elements must meet minimum color contrast ratio thresholds [https://dequeuniversity.com/rules/axe/4.8/color-contrast]
- 39. Impact Webs: a novel conceptual modelling approach ... - HESS [https://hess.copernicus.org/articles/29/3297/2025/]
- 40. The pros and cons of ecological risk assessment based on ... [https://pmc.ncbi.nlm.nih.gov/articles/PMC5141515/]
- 41. Ecological Risk Models and Tools [https://www.epa.gov/risk/ecological-risk-models-and-tools]
- 42. Overview of Risk Assessment in the Pesticide Program [https://www.epa.gov/pesticide-science-and-assessing-pesticide-risks/overview-risk-assessment-pesticide-program]
- 43. 8 Conceptual Site Model and Data Quality Objectives [https://sbr-1.itrcweb.org/conceptual-site-model-and-data-quality-objectives/]
- 44. A Comprehensive Guide to Pesticide Residue Analysis [https://scioninstruments.com/us/blog/a-comprehensive-guide-to-pesticide-residue-analysis/]
- 45. Quantifying pesticide residues in food matrices using ... [https://www.sciencedirect.com/science/article/pii/S0889157524003399]
- 46. EPA Ecological Risk Assessment Guidance [https://rais.ornl.gov/guidance/epa_eco.html]
- 47. Guidelines for Cumulative Risk Assessment Planning and ... [https://www.epa.gov/risk/guidelines-cumulative-risk-assessment-planning-and-problem-formulation]
- 48. Guidance for Data Quality Assessment [https://www.epa.gov/quality/guidance-data-quality-assessment]
- 49. About Risk Assessment | US EPA [https://www.epa.gov/risk/about-risk-assessment]
- 50. The importance of problem formulations in risk assessment [https://www.sciencedirect.com/science/article/pii/S0273230013000482]
- 51. Towards a standardised monitoring of ecosystem condition [https://www.sciencedirect.com/science/article/pii/S1470160X25008829]
- 52. How to bridge the gap between nature conservation and ... [https://www.sciencedirect.com/science/article/abs/pii/S004896972501321X]
- 53. Linking ecosystem characteristics to final ... [https://pmc.ncbi.nlm.nih.gov/articles/PMC4311437/]
- 54. Innovative Risk Management 2025 | Adapting to Uncertainty ... [https://community.trustcloud.ai/docs/grc-launchpad/grc-101/risk-management/adapting-to-uncertainty-innovative-approaches-to-risk-management-in-2024/]
- 55. The Risk-Tandem Framework: An iterative ... [https://www.sciencedirect.com/science/article/pii/S221242092400832X]
- 56. A Quick Comparison of Experimental Results [https://www.chemedx.org/blog/quick-comparison-experimental-results]
- 57. Top 6 Visualizations for Quantitative Data Analysis Methods [https://chartexpo.com/blog/quantitative-data-analysis-methods]
- 58. Alignment Through Value Consolidation Mechanisms—Focusing on Multi-Stakeholder Collaboration for Circular Economy | SpringerLink [https://link.springer.com/chapter/10.1007/978-3-031-31937-2_9]
- 59. The stakeholder game mechanisms in land use change of Caohai National Nature Reserve | Scientific Reports [https://www.nature.com/articles/s41598-025-92005-9]
- 60. Quantitative approach for assessing risks and benefits to ... [https://www.sciencedirect.com/science/article/abs/pii/S0048969725011416]
- 61. Problem formulation for risk assessment of combined ... [https://pubmed.ncbi.nlm.nih.gov/27685317/]
- 62. A roadmap for multiple stressors assessment and ... [https://www.sciencedirect.com/science/article/abs/pii/S0195925523001579]
- 63. EPA Advanced Consideration of Cumulative Impacts in ... [https://eelp.law.harvard.edu/tracker/epa-released-interim-framework-for-advancing-consideration-of-cumulative-impacts/]
- 64. 14 Comparing quantitative data between individuals [https://bookdown.org/pkaldunn/SRM-Textbook/BetweenQuantData.html]
- 65. Tiered Assessments Can Increase Accessibility for Students [https://www.edutopia.org/article/tiered-assessments-increase-accessibility/]
- 66. What Is MTSS? Multi-Tiered System of Supports [https://www.branchingminds.com/mtss-guide]
- 67. MTSS in Action: A Practical Guide [https://www.steveventura.com/blog/mtss-in-action-a-practical-guide-to-using-formative-assessment-for-tiered-instruction/]
- 68. A Comprehensive Guide to MTSS Interventions in K-12 ... [https://www.powerschool.com/blog/mtss/]
- 69. Appendix B: OMB Proposed Risk Assessment Bulletin [https://www.nationalacademies.org/read/11811/chapter/11]
- 70. Recent Additions on Risk Assessment [https://www.epa.gov/risk/recent-additions-risk-assessment]
- 71. Key challenges and developments in wildlife ecological risk ... [https://pmc.ncbi.nlm.nih.gov/articles/PMC10656671/]
- 72. Nominations of Peer Reviewers for EPA's Risk Evaluation ... [https://www.lawbc.com/nominations-of-peer-reviewers-for-epas-risk-evaluation-of-d4-are-due-september-25-2025/]
- 73. Methods for the Clinical Validation of Digital Endpoints [https://pmc.ncbi.nlm.nih.gov/articles/PMC10636620/]
- 74. Ecological and human health risk assessment: a comparison [https://link.springer.com/content/pdf/10.1007/978-94-009-1523-7_9.pdf]
- 75. Human Health Risk Assessment [https://www.epa.gov/risk/human-health-risk-assessment]
- 76. Wrangling Whole Mixtures Risk Assessment [https://pmc.ncbi.nlm.nih.gov/articles/PMC10545370/]
- 77. Using problem formulation for an efficient, fit-for-purpose ... [https://research.wur.nl/en/publications/using-problem-formulation-for-an-efficient-fit-for-purpose-risk-a]
- 78. A practical guide to the application of the IUCN Red List of ... [https://pmc.ncbi.nlm.nih.gov/articles/PMC4290417/]
- 79. Risk Characterization - an overview | ScienceDirect Topics [https://www.sciencedirect.com/topics/agricultural-and-biological-sciences/risk-characterization]
- 80. A case study of regulatory risk assessment in the United ... [https://www.sciencedirect.com/science/article/pii/S0273230024001156]
- 81. Quantitative Risk Management: What Is and How to ... [https://www.floqast.com/blog/quantitative-risk-management-what-is-and-how-to-implement-it]